
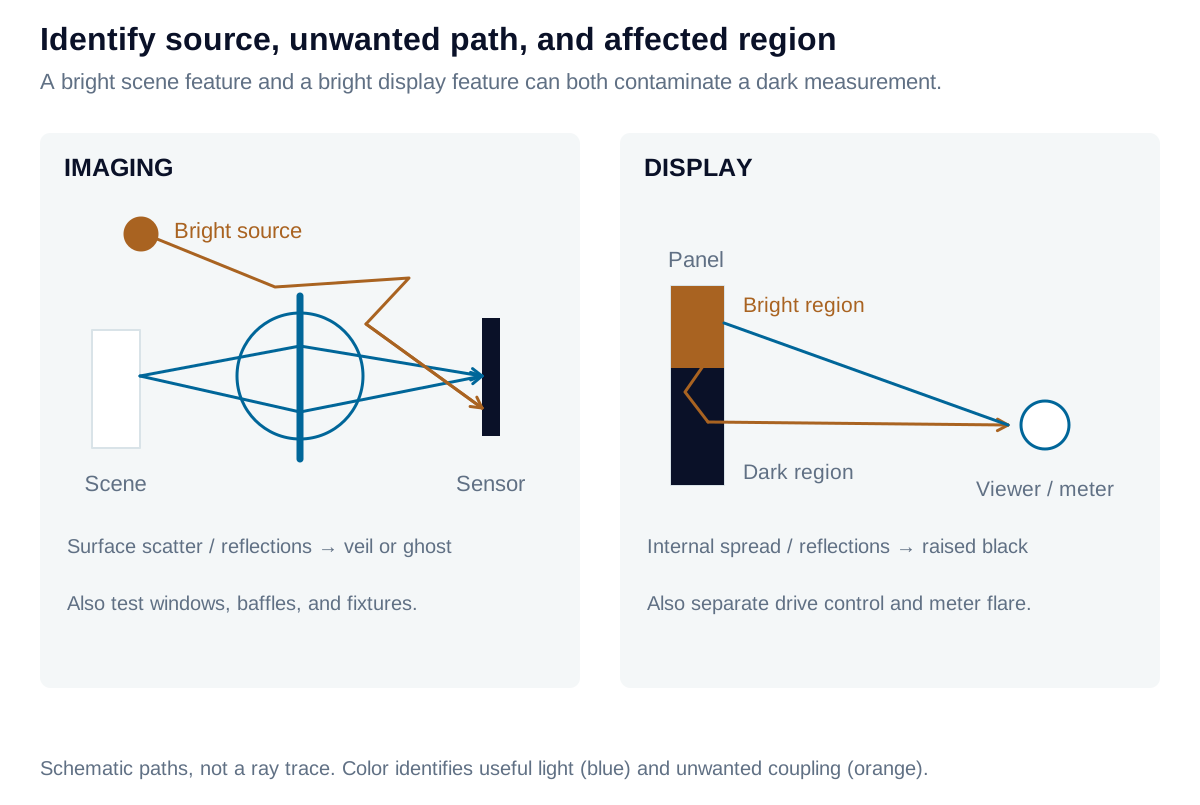
Useful image formation directs light to the intended location. Stray light reaches a detector or viewer through an unintended path. A bright scene feature can wash out a camera image; a bright display region can contaminate a neighboring dark region. The mechanisms differ by system, but the shared engineering task is to identify the source, coupling path, and affected measurement.
Imaging: distinguish veiling flare from structured ghosts
Scattering from surfaces, contamination, and internal structures can add a broad veil that reduces scene contrast. Multiple reflections can form localized ghosts, arcs, or recognizable images of a bright source. Sources outside the nominal field may still couple through the entrance aperture, especially without effective baffling.
Measure a dark region while varying a controlled bright source’s angle, position, and level. Fix exposure, focus, aperture, and processing; check saturation and sensor blooming separately. The measurement lens, cover window, and fixtures can also contribute. A flare map is therefore more informative when accompanied by the source geometry and a reference exposure.
Display: distinguish optical spread from drive behavior
Bright-to-dark leakage can arise in projection optics, scattering layers, cover structures, or the screen’s angular response. A curved screen can redistribute reflected light between regions. These paths can raise simultaneous-pattern black levels even when the full-black state remains dark.
Use bright patches or complementary patterns to map the spatial and angular response. Keep average picture level and local-dimming behavior documented. A halo from zone control and stress-induced LCD leakage are different mechanisms from optical flare, even when their images look similar. Also measure instrument flare: a camera viewing a high-contrast display can create an apparent display defect of its own.
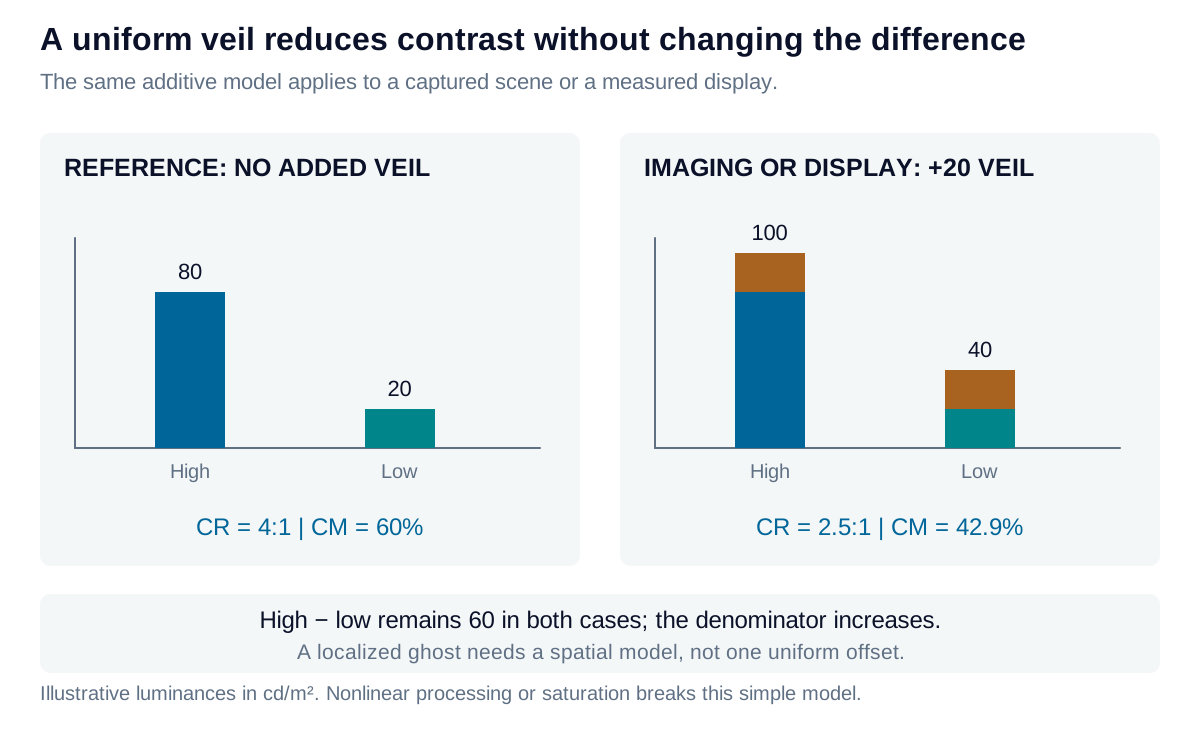
Quantify the contrast penalty
For an illustrative uniform additive veil applied to high and low luminances:
The level difference stays fixed while the background rises. A nonuniform ghost requires a spatial model; the simple veil cannot represent its shape. Do not label every brightness gradient “flare”: relative illumination primarily describes how intended light is distributed, while flare adds an unwanted contribution.
Describe directional scatter with BRDF and BTDF
The bidirectional reflectance distribution function relates reflected radiance in one direction to incident irradiance from another:
BRDF has units sr⁻¹. It is not simply a reflectance percentage: it describes where reflected power goes. A Lambertian reflector has ; a glossy surface may concentrate light near the specular direction. Wavelength and polarization can also change the response.
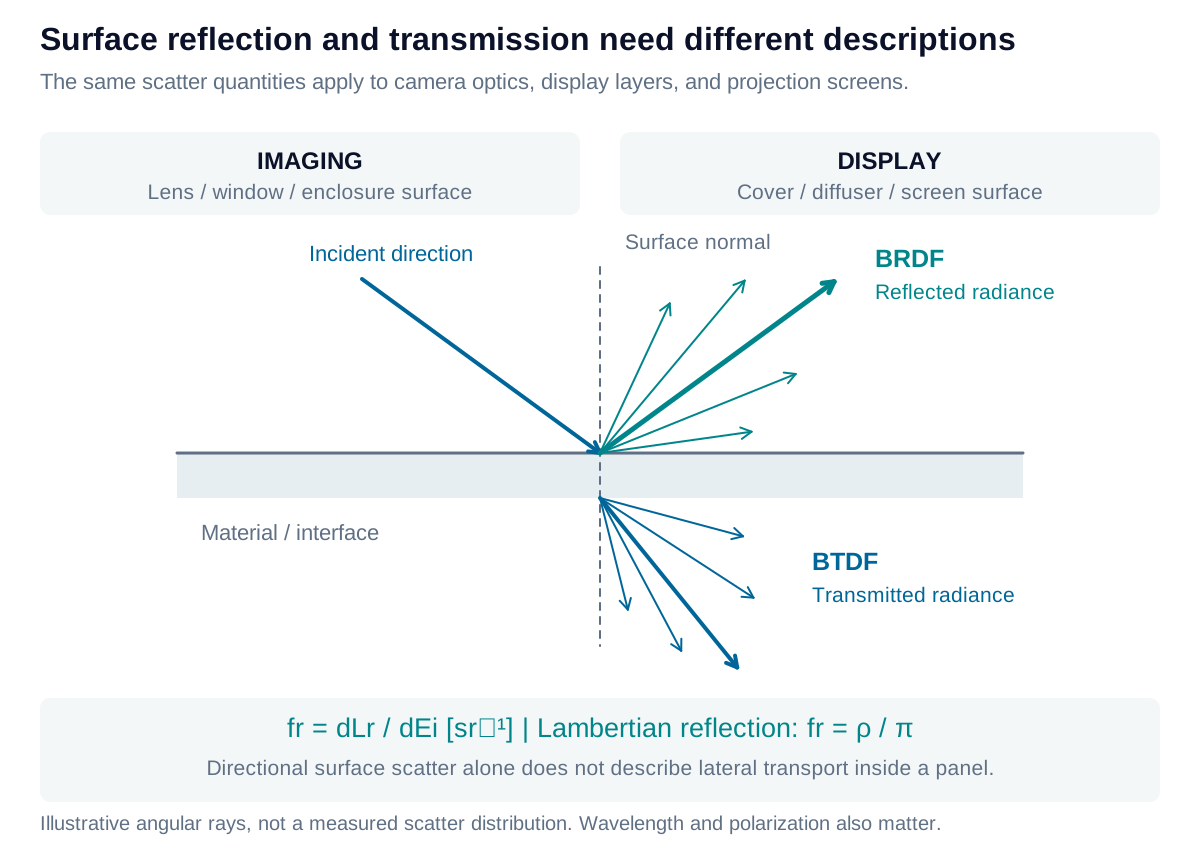
BTDF describes transmitted angular scatter. Neither a surface BRDF nor a single reflectance number alone describes lateral propagation inside a panel, bulk scattering, or repeated internal reflections. Those require the relevant material and geometric model.
From directional illumination to reflected luminance
For a fixed outgoing direction , add contributions from the incident hemisphere:
is incident radiance, is a solid-angle element, and is measured from the surface normal. The cosine converts illumination arriving from an oblique direction into its contribution per unit surface area. Compatible photometric quantities may be used when the spectral weighting is treated consistently.
For a Lambertian surface, is independent of direction. Surface illuminance is already the incident angular integral, so:
If is measured on the display or target surface, do not multiply by another incidence cosine. If illuminance is instead specified on a plane perpendicular to a collimated beam, the surface receives . This distinction prevents counting the projected-area factor twice.
For a directional surface, equal illuminance under two different angular source distributions need not give equal luminance toward the viewer. The relevant BRDF and source geometry must remain in the calculation.
For both imaging and displays, mitigation follows the identified path: baffling, coatings, cleanliness, absorptive structures, optical redesign, or changes to drive control. Verify the result with the same source and collection conditions used to reveal the failure.
Iris Optics can help isolate optical and electronic contributions, design stray-light measurements, and evaluate corrective changes for camera, projection, and display systems.