
Contrast describes the separation between a feature and its surroundings. An imaging system must preserve that separation from object to recorded image; a display must reproduce it from image data to emitted or reflected light. The same equation can describe either system, but a useful result also identifies the pattern, geometry, operating state, and measurement scale.
Match the definition to the task
For measured high and low luminances, the contrast ratio and Michelson modulation are:
Contrast ratio is usually reported as, for example, 100:1; Michelson modulation as a fraction or percentage. Weber contrast describes a feature on a substantially uniform background:
Its sign distinguishes brighter and darker features. The background must be positive. A small black-level reading demands particular care: instrument offsets, noise, and stray light can dominate the denominator. A reading below the measurement floor supports a bound, not an exact infinite contrast ratio.
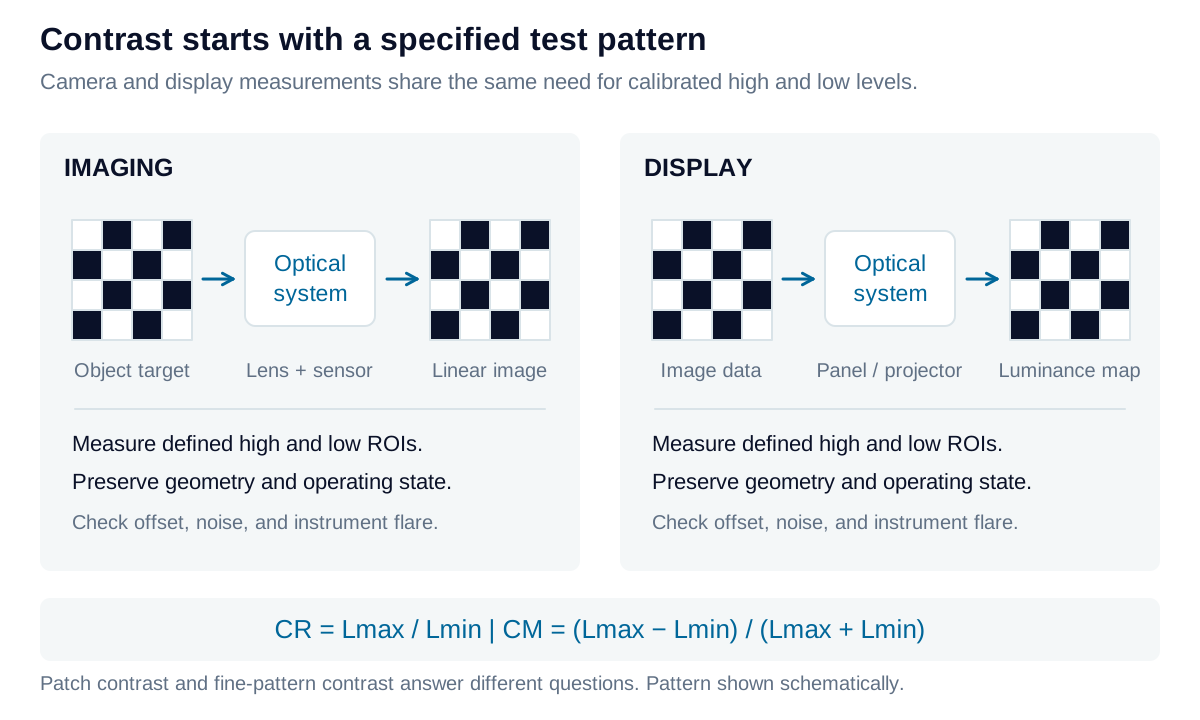
Imaging: preserve the feature against its background
Illuminate a representative target, control exposure and focus, and measure feature and background regions away from transitions when estimating patch contrast. Use linear, offset-corrected camera response; gamma-encoded pixel values are not luminance measurements. A calibrated imaging photometer can instead supply luminance directly.
Compare object and image modulation when evaluating contrast transfer. Target reflectance alone does not establish the input contrast: illumination, surface directionality, and geometry matter. Blur mixes neighboring features, while flare adds unwanted background. Both reduce visibility, but require different corrective actions. Include the feature size and field position in the result.
Display: separate sequential and simultaneous patterns
Sequential contrast compares full-white and full-black states. A checkerboard measures white and black regions simultaneously. Define its global result as the mean white luminance divided by the mean black luminance. A paired normal/inverse checkerboard can additionally measure each location in both states and average the resulting local ratios.
These are different experiments. Checkerboard dimensions, ROI placement, settling time, local dimming, and instrument flare affect the result. Spatial light spread often reduces simultaneous contrast relative to sequential contrast, but the ordering and difference are not universal. Calling a pattern “ANSI-style” does not by itself specify a complete standard-compliant method.
Two checkerboard summaries: ratio of means and mean of ratios
For a specified simultaneous checkerboard, let and be measured luminances in the selected white and black regions:
For the paired-pattern protocol, let and describe the same physical location when it is white and black in complementary patterns:
The mean of ratios generally differs from the ratio of means. Preserve the individual ratios and spatial map; one mean can conceal a weak location. This paired definition is an explicitly stated test protocol, not a universal definition of local or ANSI contrast.
Include ambient light in either optical path
A display reflects room light toward the viewer; a camera can collect ambient light from the target, enclosure, or lens. In either case, added light changes contrast. For a display with state-independent Lambertian reflectance under illuminance :
Here is in lux, in cd/m², and is dimensionless. Real directional surfaces require the actual illumination and viewing geometry; white and black states may also have different reflectances.
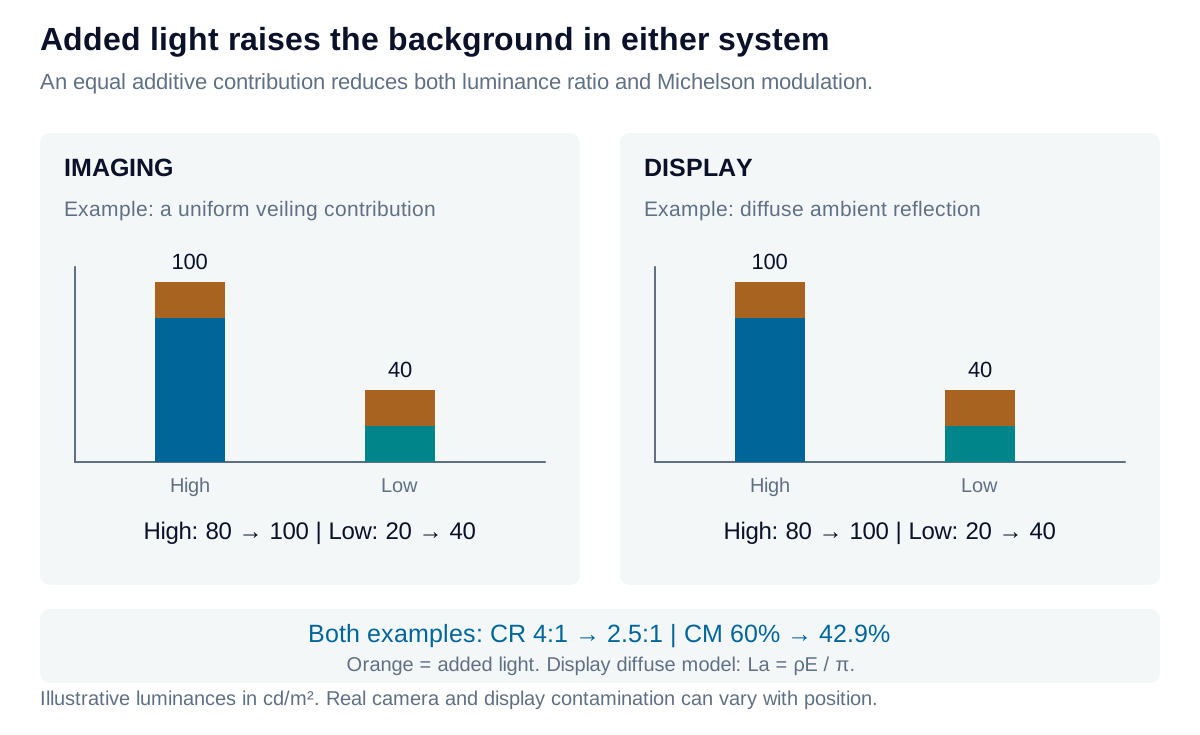
Contrast retention compares two specified ambient conditions. Retain the absolute ratios too: good retention alone does not establish usable contrast.
Iris Optics can help define comparable camera and display contrast tests, separate optical effects from measurement artifacts, and connect acceptance limits to the application’s critical features.