06 / 06   Averages & difference

Application note

Spectral Averages and Color Difference

Choose a weighting rule, preserve the reference conditions, and compare color consistently.

A single average cannot describe every useful property of an optical spectrum. A coating can retain substantial radiant power while suppressing visually important wavelengths, or preserve luminance while shifting color. Start by specifying the quantity that the acceptance criterion is meant to control.

Choose what receives equal weight

For a throughput curve HH over [λa,λb][\lambda_a,\lambda_b], a uniform-in-wavelength mean is:

Hˉλ=∫λaλbH(λ) dλλb−λa\bar H_\lambda=\frac{\int_{\lambda_a}^{\lambda_b}H(\lambda)\,d\lambda} {\lambda_b-\lambda_a}

This gives equal weight to equal wavelength intervals. It is not generally the arithmetic mean of measured rows. Dense sampling in one band must not give that band extra weight simply because more measurements were taken there.

Photopic-only and source-weighted luminous means instead use:

HˉV=∫HV dλ∫V dλ,HˉSV=∫SHV dλ∫SV dλ\bar H_V=\frac{\int HV\,d\lambda}{\int V\,d\lambda},\qquad \bar H_{SV}=\frac{\int SHV\,d\lambda}{\int SV\,d\lambda}

The V-only result corresponds to an equal-energy spectral source over the integration band. It is not automatically the luminous result under daylight or a particular lamp. State the wavelength interval and source with every reported percentage.
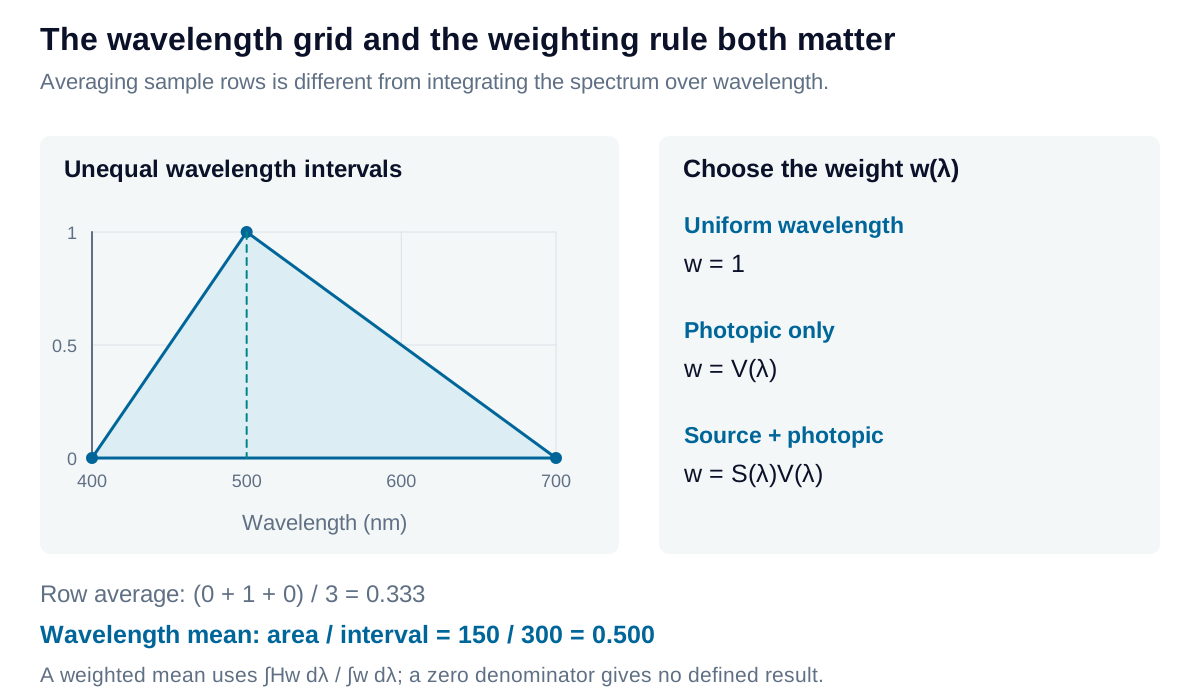
Uniform, photopic-only, and source-weighted means assign different importance to a synthetic throughput spectrum. Irregular sample spacing changes integration weights.

View diagram at full size

Integrate irregular samples with interval widths

For ordered samples of an integrand fi=f(λi)f_i=f(\lambda_i), trapezoidal quadrature gives:

∫f(λ) dλ≈∑i=0N−2fi+fi+12(λi+1−λi)\int f(\lambda)\,d\lambda\approx \sum_{i=0}^{N-2}\frac{f_i+f_{i+1}}{2}(\lambda_{i+1}-\lambda_i)

For example, throughput values (0,1,0)(0,1,0) sampled at wavelengths (400,500,700)(400,500,700) nm have an arithmetic row mean of 1/31/3. Their piecewise-linear integral is 150 nm, giving a wavelength mean of 150/300=0.5150/300=0.5. Sampling density and interval width are different quantities.

Apply the rule separately to a weighted numerator and denominator on a compatible grid. Interpolation aligns data; it cannot recover narrow spectral features that were never measured. Even a uniform grid requires consistent endpoint treatment.

Carry XYZ into a reference-relative space

CIELAB expresses XYZ relative to a white reference (Xn,Yn,Zn)(X_n,Y_n,Z_n) computed using the same illuminant and observer:

L∗=116f(Y/Yn)−16L^*=116f(Y/Y_n)-16 a∗=500[f(X/Xn)−f(Y/Yn)],b∗=200[f(Y/Yn)−f(Z/Zn)]a^*=500[f(X/X_n)-f(Y/Y_n)],\qquad b^*=200[f(Y/Y_n)-f(Z/Z_n)]

Lightness L∗L^* is nonlinear in relative Y. The a∗a^* and b∗b^* coordinates describe opposing chromatic directions. Lab therefore does not preserve the additive spectral relationship used to calculate XYZ.

The CIELAB piecewise function

With δ=6/29\delta=6/29:

f(t)={t1/3,t>δ3t/(3δ2)+4/29,t≤δ3f(t)=\begin{cases} t^{1/3},&t>\delta^3\\ t/(3\delta^2)+4/29,&t\leq\delta^3 \end{cases}

The linear branch makes the transformation finite near zero and joins the cube-root branch continuously in value and slope. The sample and reference XYZ must use the same normalization. A perfect reference has (L∗,a∗,b∗)=(100,0,0)(L^*,a^*,b^*)=(100,0,0); zero XYZ gives (0,0,0)(0,0,0).

For a spectrally neutral 40% sample with the same reference white, the common XYZ scale cancels in the ratios: L∗≈69.47L^*\approx69.47 and a∗=b∗=0a^*=b^*=0. By contrast, two selective samples can have the same wavelength-average throughput while returning different Lab coordinates. A scalar throughput specification and a color specification therefore answer different questions.

Compare colors with a named metric

CIE76 is Euclidean distance in Lab:

ΔE76=(ΔL∗)2+(Δa∗)2+(Δb∗)2\Delta E_{76}=\sqrt{(\Delta L^*)^2+(\Delta a^*)^2+(\Delta b^*)^2}

CIEDE2000, written ΔE00\Delta E_{00}, adjusts lightness, chroma, and hue contributions and includes a chroma–hue interaction. It is a different metric, not another way to compute the same numerical distance. Its standard parametric factors are commonly set to one; application-specific conditions may require an agreed alternative.

The structure of the CIEDE2000 calculation

Define the normalized lightness, chroma, and hue contributions using the CIEDE2000 corrections:

qL=ΔL′kLSL,qC=ΔC′kCSC,qH=ΔH′kHSHq_L=\frac{\Delta L'}{k_LS_L},\qquad q_C=\frac{\Delta C'}{k_CS_C},\qquad q_H=\frac{\Delta H'}{k_HS_H}

Then:

ΔE00=qL2+qC2+qH2+RTqCqH\Delta E_{00}=\sqrt{q_L^2+q_C^2+q_H^2+R_Tq_Cq_H}

The primed differences, scale terms SL,SC,SHS_L,S_C,S_H, and rotation term RTR_T follow the full CIEDE2000 definition. They are not obtained by directly substituting Δa∗\Delta a^* and Δb∗\Delta b^*. In particular, hue wraps around a circle and becomes undefined at zero chroma, requiring explicit branch handling. The calculator implements those branches and uses kL=kC=kH=1k_L=k_C=k_H=1.

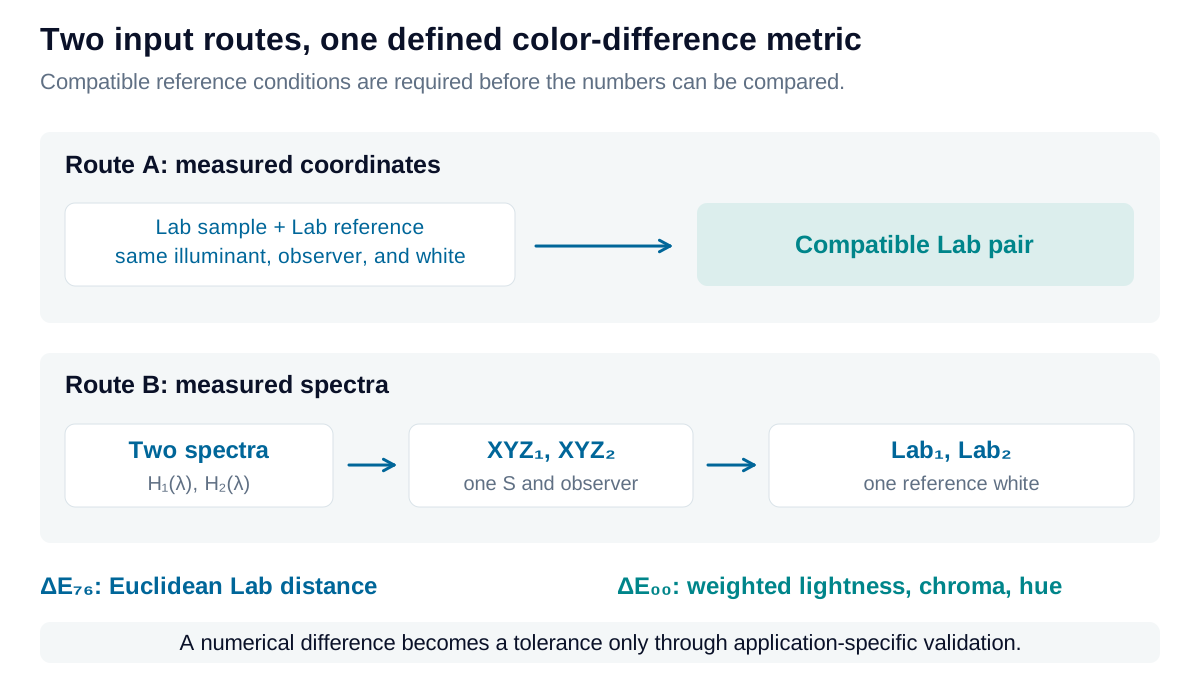
Two routes reach the same color-difference calculation: enter compatible Lab coordinates directly, or derive them from two spectra under the same illuminant, observer, and white reference.

View diagram at full size

There are two useful input routes to ΔE00\Delta E_{00}: compare compatible measured Lab coordinates, or calculate XYZ and Lab from each spectrum first. The latter preserves the ability to investigate source-dependent differences. Both routes require matching reference conditions; entering Lab alone cannot verify them.

A difference value is not a universal pass/fail decision. Geometry, texture, gloss, adaptation, measurement variation, and the task affect visibility and acceptability. Establish a tolerance using representative parts and controlled viewing, then confirm that the measurement can resolve that tolerance.

Explore the model

Compare spectral averages

Compare a shaped sample with a neutral reference under three explicit weighting choices.

Change the values to update the results and visualization.

D65: standard daylight. E: equal spectral power per nm.

Wavelength-interval mean
55.745 %
V-only weighted mean
55.157 %
D65-weighted luminous throughput
53.16 %
XYZ · white Y = 100
60.845, 53.16, 21.855
CIELAB · same illuminant white
77.97, 25.88, 44.916
Reference CIELAB
76.069, 0, 0
CIEDE2000 ΔE₀₀
24.32

The normalized weighting curves each integrate to one. For E, the two photopic curves coincide. The spectrum-to-Lab route uses the selected illuminant for both specimens and their common white. The direct-Lab calculator below starts at the final comparison step.

Compare spectral averages: interactive plotPower throughput / fraction against Wavelength in standard air / nm. Curves: Shaped sample H; Neutral reference H. 36004540.25480.46420.67360.88301Wavelength in standard air / nmPower throughput / fraction
Shaped sample HNeutral reference H
Compare spectral averages — observer weighting: interactive plotNormalized weight / nm⁻¹ against Wavelength in standard air / nm. Curves: Uniform wavelength weight; V-only normalized weight; D65 × V normalized weight. 36004540.002165480.004316420.006477360.008628300.0108Wavelength in standard air / nmNormalized weight / nm⁻¹
Uniform wavelength weightV-only normalized weightD65 × V normalized weight
Formula & assumptions

⟨H⟩w = ∫H(λ)w(λ)dλ / ∫w(λ)dλ. Use w = 1, V(λ), or S(λ)V(λ).

Both synthetic spectra share the full 360–830 nm grid, illuminant, and white. The raw result is a wavelength-interval mean. V-only weighting corresponds to an equal-energy source; luminous throughput includes the selected illuminant. ΔE00 compares their Lab values with kL = kC = kH = 1. The color difference is not an average of wavelength-wise differences.

Explore the model

Compare two CIELAB measurements

Calculate CIEDE2000 and CIE76 from a reference and a sample.

Change the values to update the results and visualization.

CIEDE2000 ΔE₀₀
2.0425
CIE76 ΔE*ab
4.0011
Lightness difference ΔL*
0

The a*b* plot is a projection. Its line length is not ΔE00; lightness and perceptual weighting also contribute.

Compare two CIELAB measurements: interactive plotCIELAB b* against CIELAB a*. Curves: a*b* separation (L* not plotted). Reference: 2.6772, -79.775; Sample: 0, -82.749-103-103-62.1-62.1-20.7-20.720.720.762.162.1103103ReferenceSampleCIELAB a*CIELAB b*
a*b* separation (L* not plotted)
Formula & assumptions

ΔE76 = √(ΔL*² + Δa*² + Δb*²). ΔE00 applies the CIEDE2000 lightness, chroma, hue, and interaction terms.

Both Lab measurements must use the same observer, illuminant/reference white, geometry, and measurement conditions. CIEDE2000 uses standard parametric factors kL = kC = kH = 1. Lab coordinates are accepted numerically; this does not certify that a pair corresponds to realizable samples. A universal pass/fail or visibility threshold is not supplied.

Reference data: CIE 1931 2° observer and Illuminant D65. Numeric tables © CIE, used under CC BY-SA 4.0; derived data plots share this license. Tables retained at 1 nm on the common 360–830 nm interval. Figures and calculations by Iris Optics.

From estimate to application

Make optical acceptance criteria reproducible.

The wavelength interval, weighting, white reference, and color-difference method belong in the specification. Establish them around your actual parts and tolerances.

Review your optical specification