
A color specification connects a physical light stimulus with a visual response under stated conditions. Wavelength alone cannot describe the color of a coating, display, or illuminated part: the spectrum, viewing level, adaptation, and surrounding scene all matter. Separating these quantities is the first step toward a useful measurement.
Begin with the light
A monochromatic stimulus contains one wavelength in the ideal limit; practical sources have finite bandwidth. Most familiar light is a mixture of wavelengths. A spectral power distribution describes how radiant power is distributed with wavelength, commonly per nanometer. Its integral gives radiant power over the stated band.
A photon at vacuum wavelength carries energy:
Shorter wavelengths carry more energy per photon. A 450 nm photon carries approximately 2.76 eV; a 650 nm photon carries approximately 1.91 eV. Neither photon energy nor photon count alone predicts a visual color or brightness. The visual system weights wavelengths differently.
Three overlapping cone responses
Under photopic viewing conditions, three cone classes contribute to human color matching: long-, medium-, and short-wavelength sensitive cones, abbreviated L, M, and S. Their broad, overlapping sensitivities allow one wavelength to stimulate several classes. They are not separate red, green, and blue detectors. Rods support vision at lower light levels but do not provide the same trichromatic discrimination.
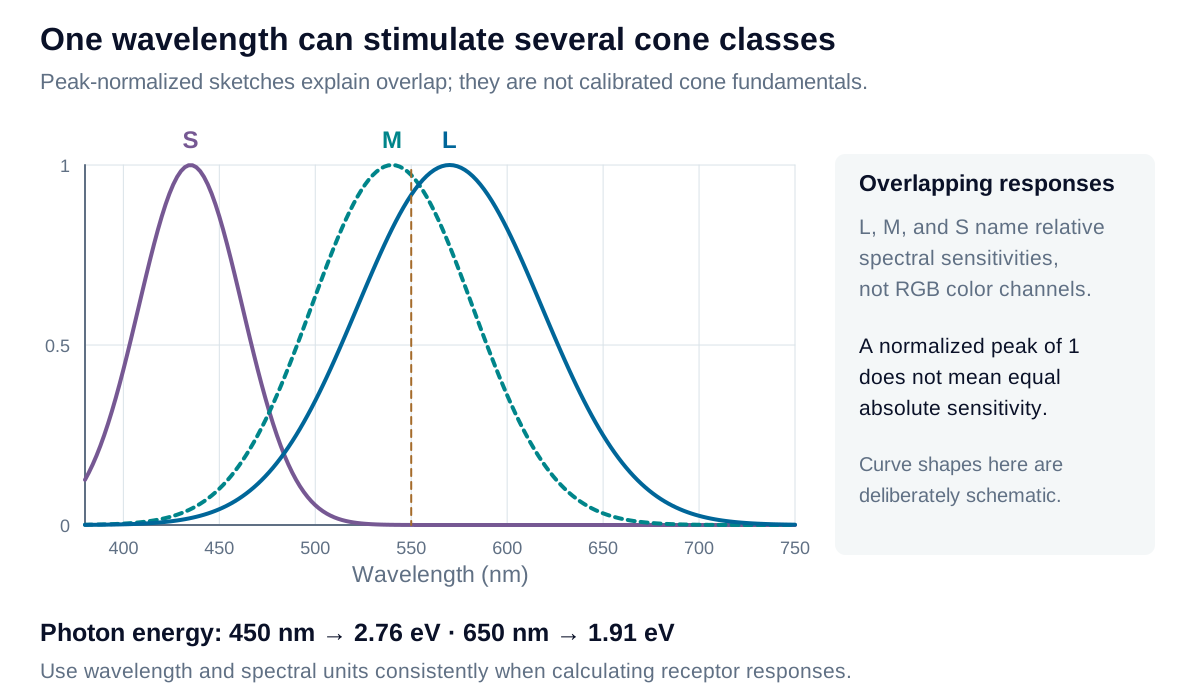
For energy-based cone sensitivities and a compatible spectral stimulus :
A photon-based stimulus requires sensitivities defined on the same basis. Peak normalization makes curve shapes easier to compare; it does not establish equal absolute sensitivity, cone population, or signal strength. Real cone fundamentals include physiological and viewing-condition effects. Symmetric bell curves are useful sketches, not calibrated replacements.
What normalization and a bell-shaped approximation mean
For a specified cone sensitivity , peak normalization gives:
Each channel can be normalized separately, so the three unit peaks do not retain their original relative amplitudes. The schematic curves use the form:
Here locates a peak and controls its width. This is a shape illustration, not a probability distribution over colors or a calibrated cone model. Real sensitivities are not symmetric Gaussians; use the appropriate tabulated functions for quantitative work.
Distinguish luminance from brightness
Luminance is a photometric quantity in cd/m². It weights spectral radiance with the photopic luminous-efficiency function :
The factor is approximately 683 lm/W, with compatible spectral units. For monochromatic radiation, luminous efficacy is approximately lm/W of radiant power; electrical efficiency is a separate quantity. Equal radiant power at different wavelengths therefore need not give equal luminance.
Brightness describes visual appearance and depends on adaptation and context. Luminance is not a count of photons per unit area, and equal luminance does not guarantee equal apparent brightness.
A spectrum does not contain every color category
Some cyan stimuli are monochromatic. Purple and magenta require spectral mixtures; there is no single purple wavelength. Pink combines a reddish stimulus with a lighter appearance. White is an adapted neutral reference, not a universal maximum of all three cone signals.
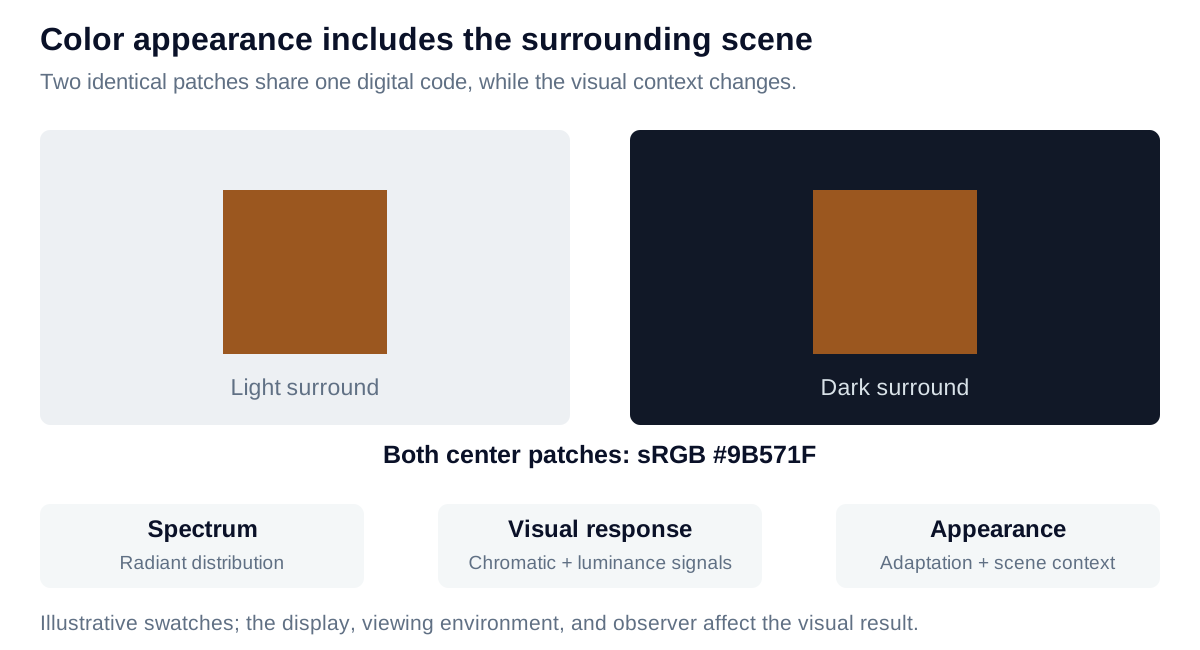
Black can describe a low-luminance region relative to its surroundings even when it returns some light. Brown commonly describes an orange or yellow appearance at low lightness relative to a brighter context. Consequently, a measurement intended to track appearance should define the viewing background and illumination along with the sample.