
01 / 03   Accuracy & precision

Application note

Accuracy, Precision, and Process Capability

Separate measurement bias and spread before comparing either with an engineering tolerance.

A camera measurement, display luminance reading, or dimensional inspection is useful only when its uncertainty is small enough for the decision. Repeated values can agree closely and still be wrong. Equally, an average can lie near a reference while individual readings vary too widely to support acceptance.

Separate bias from precision

Accuracy describes how closely a measurement agrees with the quantity’s true value; it involves both trueness and precision. Trueness concerns the average result relative to a reference, while precision concerns agreement among repeated measurements under stated conditions. Neither accuracy nor trueness is itself a numerical error metric. Estimated bias and standard deviation provide quantitative descriptions:

b=xˉ−xref,s=∑i=1n(xi−xˉ)2n−1b=\bar{x}-x_{\mathrm{ref}},\qquad s=\sqrt{\frac{\sum_{i=1}^{n}(x_i-\bar{x})^2}{n-1}}

A tight, displaced dart cluster illustrates small spread with bias. A broad, centered cluster illustrates small observed mean bias with poor precision; it does not establish accurate individual results. The reference also has uncertainty, and a finite sample does not reveal the exact long-run mean.
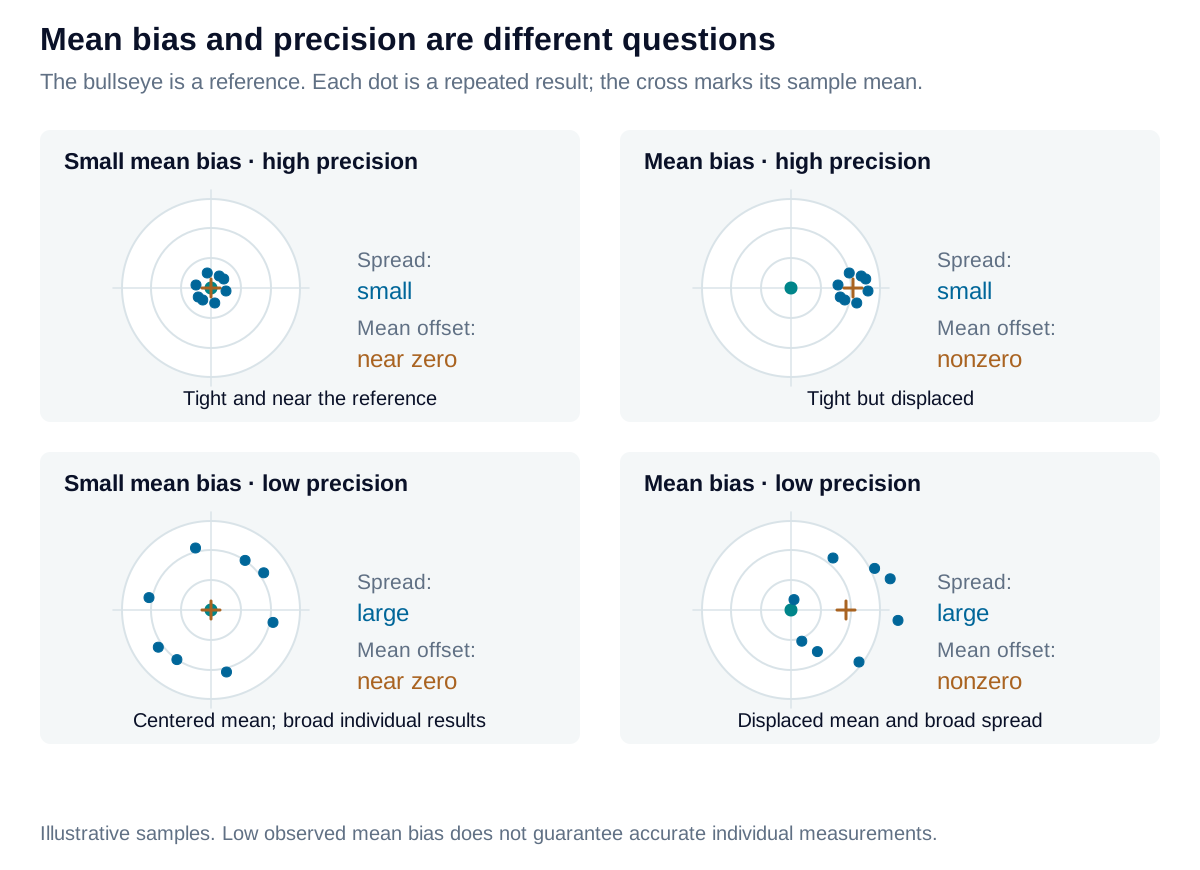
Four dartboard patterns separate tight or broad spread from centered or displaced sample means. A centered broad group still has poor individual agreement.

View diagram at full size

State the conditions behind the spread

Repeatability holds the procedure, operator, measurement system, location, and operating conditions substantially fixed over a short period. Reproducibility evaluates precision across different locations, operators, and measurement systems, with the changed conditions stated. Intermediate precision commonly describes changes over time within one laboratory.

Precision is therefore the broader term. Manufacturing Gage R&R uses “reproducibility” for the operator-related component of its declared study; this does not automatically establish performance across laboratories. Repositioning a part, refocusing a camera, or changing a display fixture can introduce variation that repeated software reads alone miss.

Compare measurement spread with tolerance

For a two-sided engineering tolerance T=USL−LSLT=USL-LSL, define a six-standard-deviation precision-to-tolerance ratio:

P/T=6σgageUSL−LSL,%Tolerance=100(P/T)P/T=\frac{6\sigma_{\mathrm{gage}}}{USL-LSL},\qquad \%\mathrm{Tolerance}=100(P/T)

The multiplier is a reporting convention, not a confidence interval for the estimated standard deviation. State whether σgage\sigma_{\mathrm{gage}} represents repeatability alone or total Gage R&R. P/T omits bias and other uncertainty contributions. A one-sided specification does not supply a tolerance width without an additional justified engineering bound.
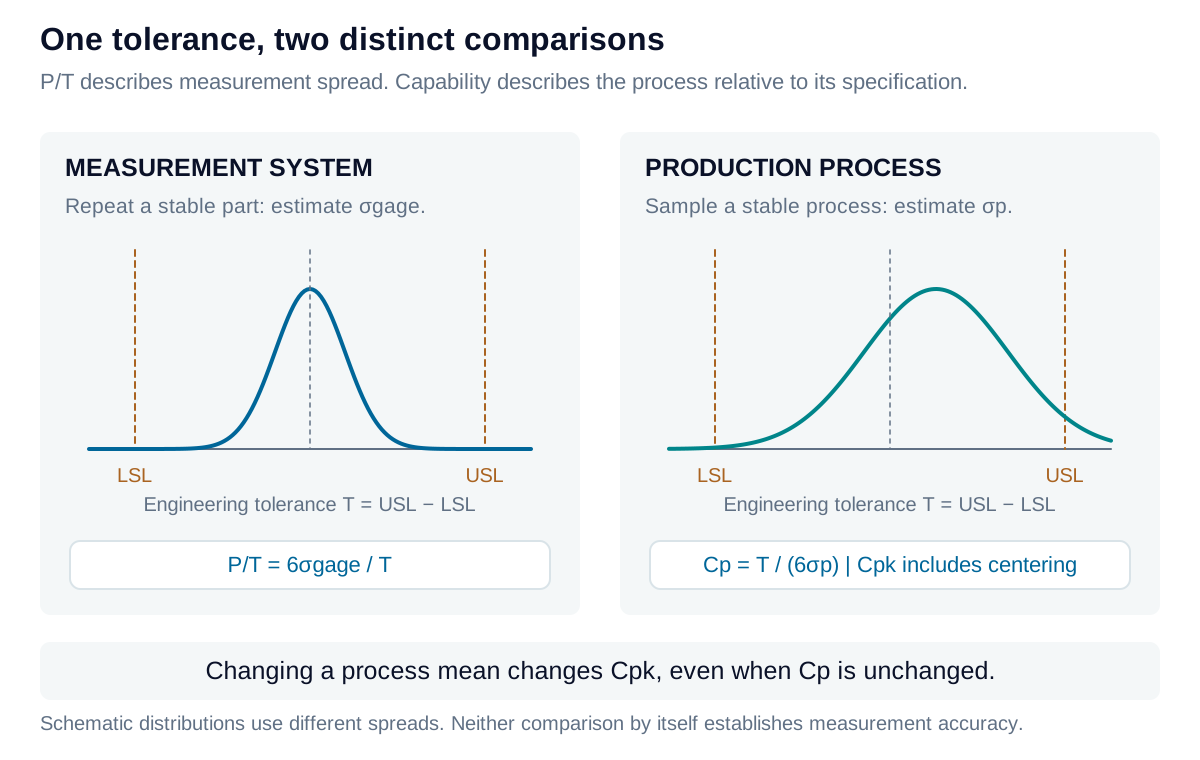
Engineering tolerance is compared separately with measurement spread and process spread; a shifted process can have unchanged Cp but lower Cpk.

View diagram at full size

Keep process capability separate

Capability compares a stable process distribution with specification limits. Using its mean μ\mu and a suitable within-process standard deviation σp\sigma_p:

Cp=USL−LSL6σp,CPU=USL−μ3σp,CPL=μ−LSL3σpC_p=\frac{USL-LSL}{6\sigma_p},\quad C_{PU}=\frac{USL-\mu}{3\sigma_p},\quad C_{PL}=\frac{\mu-LSL}{3\sigma_p} Cpk=min⁡(CPU,CPL)C_{pk}=\min(C_{PU},C_{PL})

CpC_p describes potential spread relative to tolerance; CpkC_{pk} also responds to centering. A single upper or lower limit supports the corresponding one-sided index. These are process indices, not measurement-system approval scores. Measurement noise inflates observed spread, while bias can shift apparent centering. Check measurement suitability and process stability first; non-normal data may require another capability model. An overall standard deviation convention produces performance indices PpP_p and PpkP_{pk} rather than within-process CpC_p and CpkC_{pk}.

Iris Optics can help separate instrument variation from product variation and establish measurement requirements that support defensible camera, display, and optical acceptance decisions.

Explore the measurement

Repeated measurements and bias

Explore the difference between spread and a shift in the mean. The synthetic example measures one dimension in millimetres.

Readings
8
Mean
10.012
Sample standard deviation
0.002
Estimated bias (mean − reference)
0.012
Repeated measurements and bias: interactive plotMeasurement / entered units against Reading number. Repeated readings; Reference value; Sample mean.0.449.99882.4710.0034.510.0086.5310.0128.5610.016Reading numberMeasurement / entered units
Repeated readingsReference valueSample mean
Formula & assumptions

Bias estimate = sample mean − reference. Sample standard deviation uses n − 1 in its denominator. All readings must represent repeated measurements of the same stable measurand under declared conditions.

The reference has its own uncertainty. These descriptive point estimates do not establish traceability, an uncertainty budget, or a confidence interval for bias.

Explore the measurement

Process capability and precision budget

Compare a stable process with its specification limits, then evaluate the separate measurement spread against the same tolerance.

Use one consistent unit. The synthetic example is in millimetres.

Cp
1.6667
Cpl
1.8333
Cpu
1.5
Cpk
1.5
Gage study width (6σgage)
0.018
Precision / tolerance
9 %
Process capability and precision budget: interactive plotNormal profile / relative height against Process result / entered units. Illustrative normal process profile; LSL; USL.9.884-0.089.9420.21100.510.0580.7910.1161.08Process result / entered unitsNormal profile / relative height
Illustrative normal process profileLSLUSL
Formula & assumptions

Cp = (USL − LSL)/(6σwithin); Cpl = (μ − LSL)/(3σwithin); Cpu = (USL − μ)/(3σwithin). Cpk is the smaller available one-sided index. P/T = 6σgage/(USL − LSL).

Supply a justified within-process estimate from a stable process; the normal profile is an illustration, not a fitted distribution or a prediction of yield. Do not substitute mixed-part GR&R spread for process variation. Overall spread leads to performance indices Pp/Ppk instead. A one-sided specification has no full-width Cp or P/T here.

From estimate to application

Define the measurement performance your tolerance needs.

Iris Optics can help separate bias, measurement variation, and process variation, then develop an uncertainty and acceptance plan for your application.

Review your measurement requirements