
03 / 03   Surface form & wavefronts

Application note

From Surface Topography to Wavefront Error

Separate form, waviness, and roughness, then connect surface form error to optical performance.

A measured height map contains more than surface roughness. Part shape, fixture alignment, waviness, fine texture, and measurement noise can all contribute. Useful reporting states the aperture, lateral sampling, reference geometry, removed terms, spatial filters, and treatment of missing points before quoting a single number.

Separate surface form from texture

Surface form describes the overall geometry. Surface form error (SFE) is departure from a specified nominal or reference form over a declared aperture. Waviness and roughness describe longer and shorter spatial-scale texture after a defined separation. Their boundaries depend on the specified filters and nesting indices; they are not universal frequency bands.
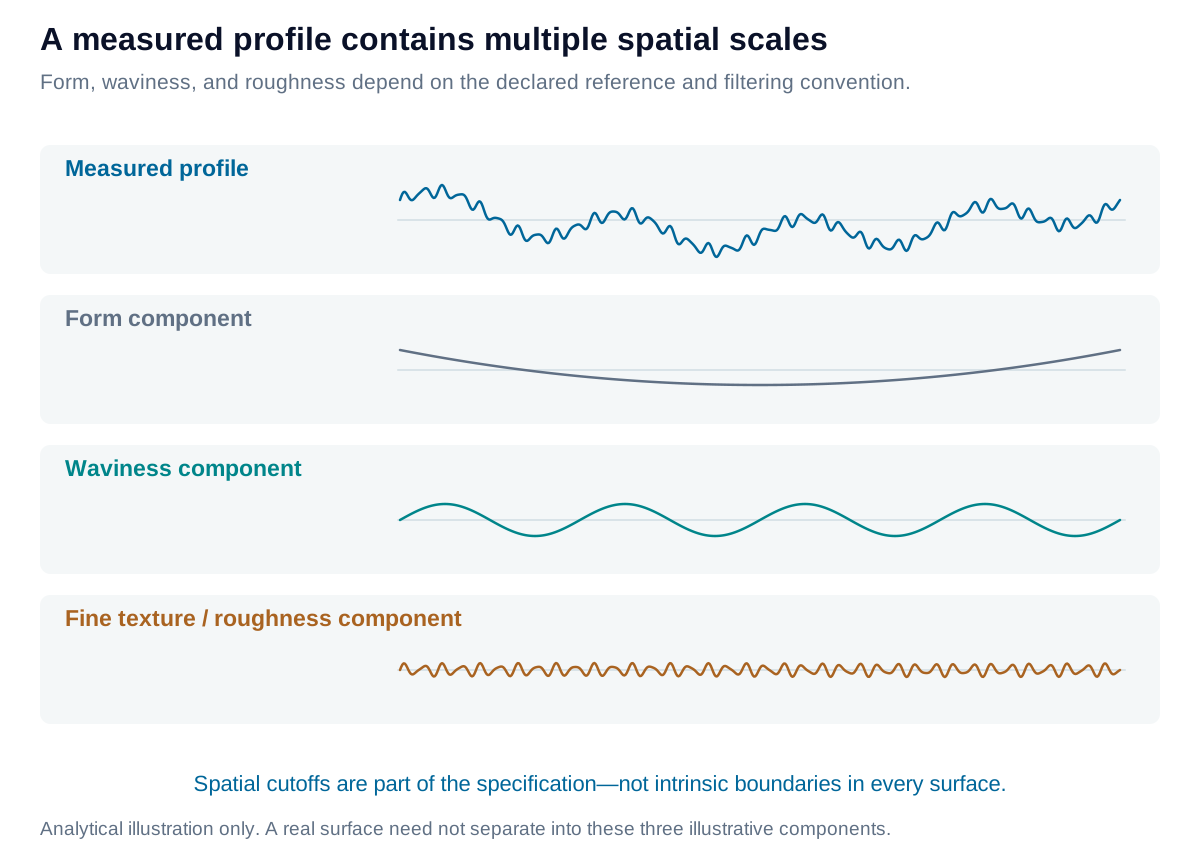
An illustrative profile combines nominal form, waviness, and roughness. The components depend on declared spatial-scale separation.

View diagram at full size

Remove fixture tilt or fit a nominal surface only when the measurand permits it. Removing a quadratic shape can conceal bow that the drawing actually limits. Filtering does not distinguish unwanted noise from legitimate fine structure without a justified bandwidth; edge effects, gaps, and instrument lateral resolution also matter.
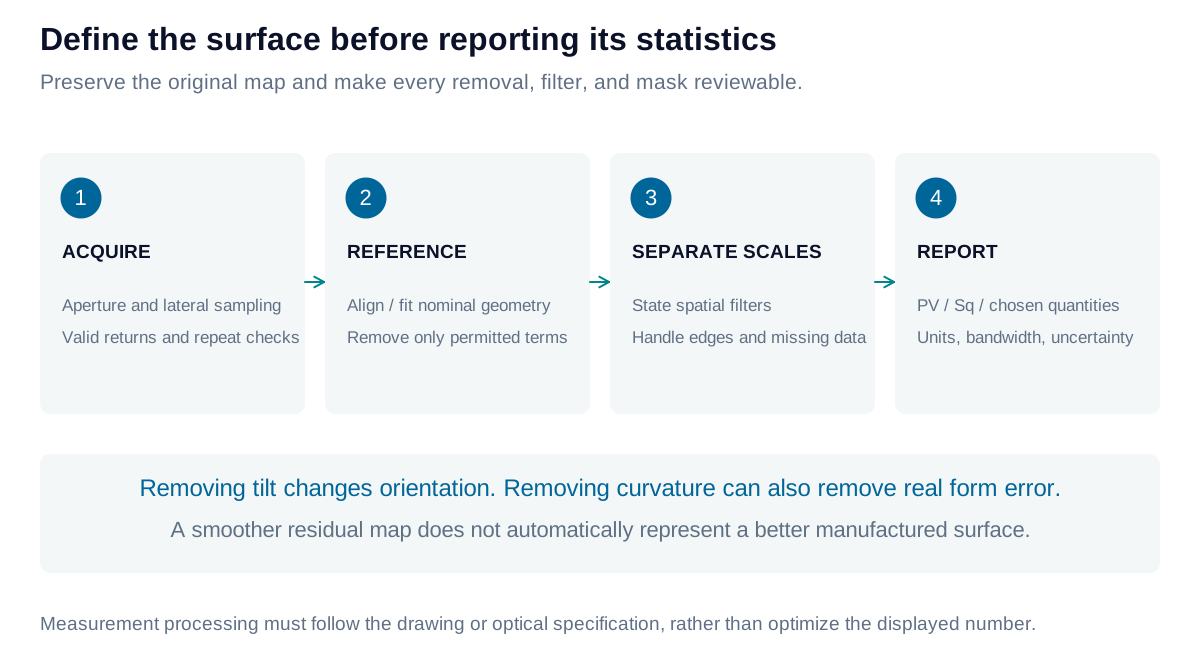
A measurement workflow retains the original height map, declares reference-form removal and spatial filtering, and reports metrics for the resulting surface.

View diagram at full size

State the statistic and its reference

For a residual height map ziz_i relative to its declared mean/reference, peak-to-valley is the maximum minus minimum. Mean-centered root-mean-square height describes distributed variation:

PV=max⁡(zi)−min⁡(zi),Sq=1N∑izi2PV=\max(z_i)-\min(z_i),\qquad S_q=\sqrt{\frac{1}{N}\sum_i z_i^2}

The displayed SqS_q expression assumes a mean-centered, equally area-weighted surface. Profile analogues use RqR_q after the required profile processing. “Peak-to-peak” often denotes the same range, but does not specify the filtering. Areal SzS_z is maximum peak height plus maximum pit depth on the defined scale-limited surface.

PV is sensitive to isolated extremes. Minimum-zone flatness instead minimizes separation between two enclosing parallel planes and still includes outliers. A proprietary robust PV statistic is a separate construction; it is not automatically equivalent to either quantity.
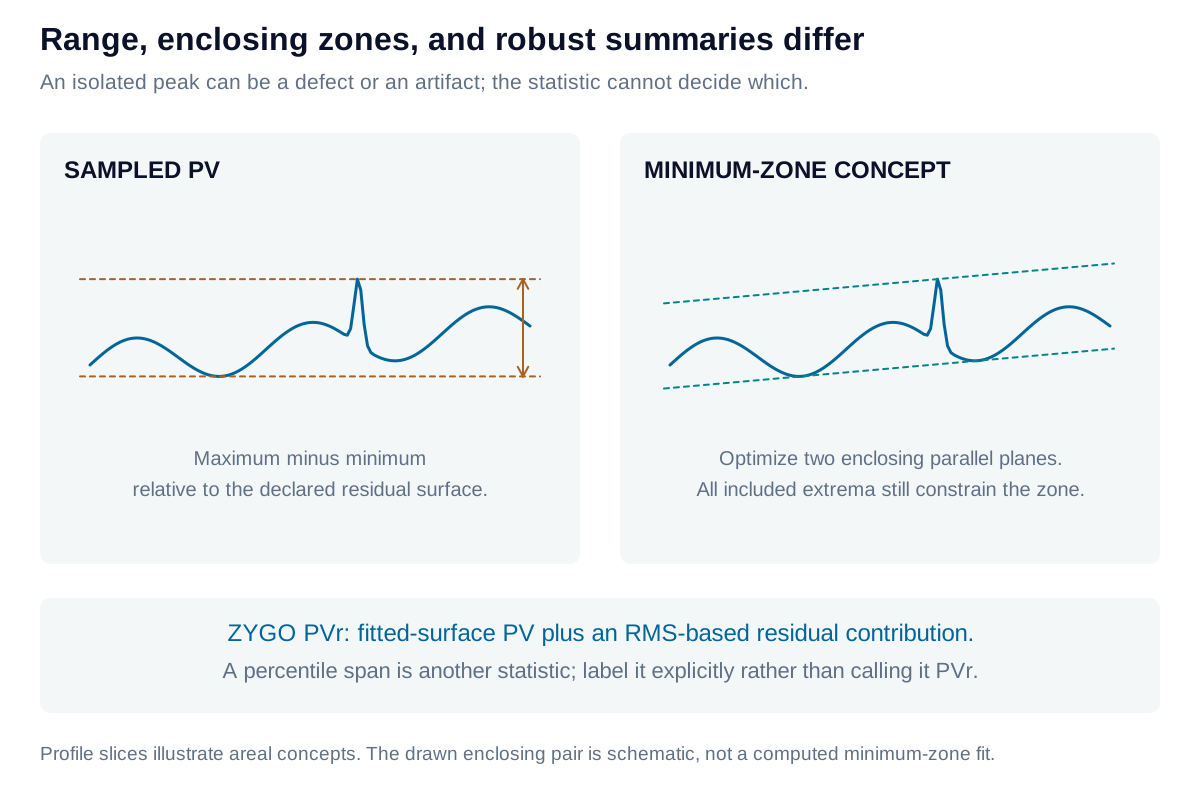
PV, minimum-zone flatness, and robust statistics answer different questions; enclosing planes do not automatically reject outlying points.

View diagram at full size

Robust PV, RMS, and declared data treatment

ZYGO’s published PVr method combines the PV of a fitted 36-term Zernike surface with an RMS-based residual contribution. It separates a smooth fitted contribution from unresolved residual structure; it is not the minimum separation of two planes enclosing every measured point. Report the software’s actual definition and fitting aperture rather than labeling a percentile range or another custom statistic “PVr.”

The calculator below reports sampled profile PV and mean-centered RMS, with optional straight-line removal. It does not implement standardized roughness filtering, ZYGO PVr, or certified minimum-zone flatness. A percentile span would be another explicitly defined statistic, not a substitute for these quantities. No statistic repairs invalid points automatically. Preserve raw data, explain masking, and investigate whether an isolated peak is noise, contamination, or a real defect.

Raw RMS about zero includes the mean offset: RMS02=zˉ2+RMScentered2RMS_0^2=\bar z^2+RMS_{\mathrm{centered}}^2. A residual surface after piston, tilt, or form removal is a different measurand from the original map. Report both the permitted removals and the resulting statistic.

Describe wavefront shape with Zernike modes

Wavefront error is optical-path departure from a reference wavefront. Zernike polynomials describe this shape over a circular pupil: piston is a constant offset; tilt is a ramp; defocus is radially quadratic; astigmatism and coma describe other distinct shapes. Coefficients need a stated normalization, indexing convention, units, and pupil.
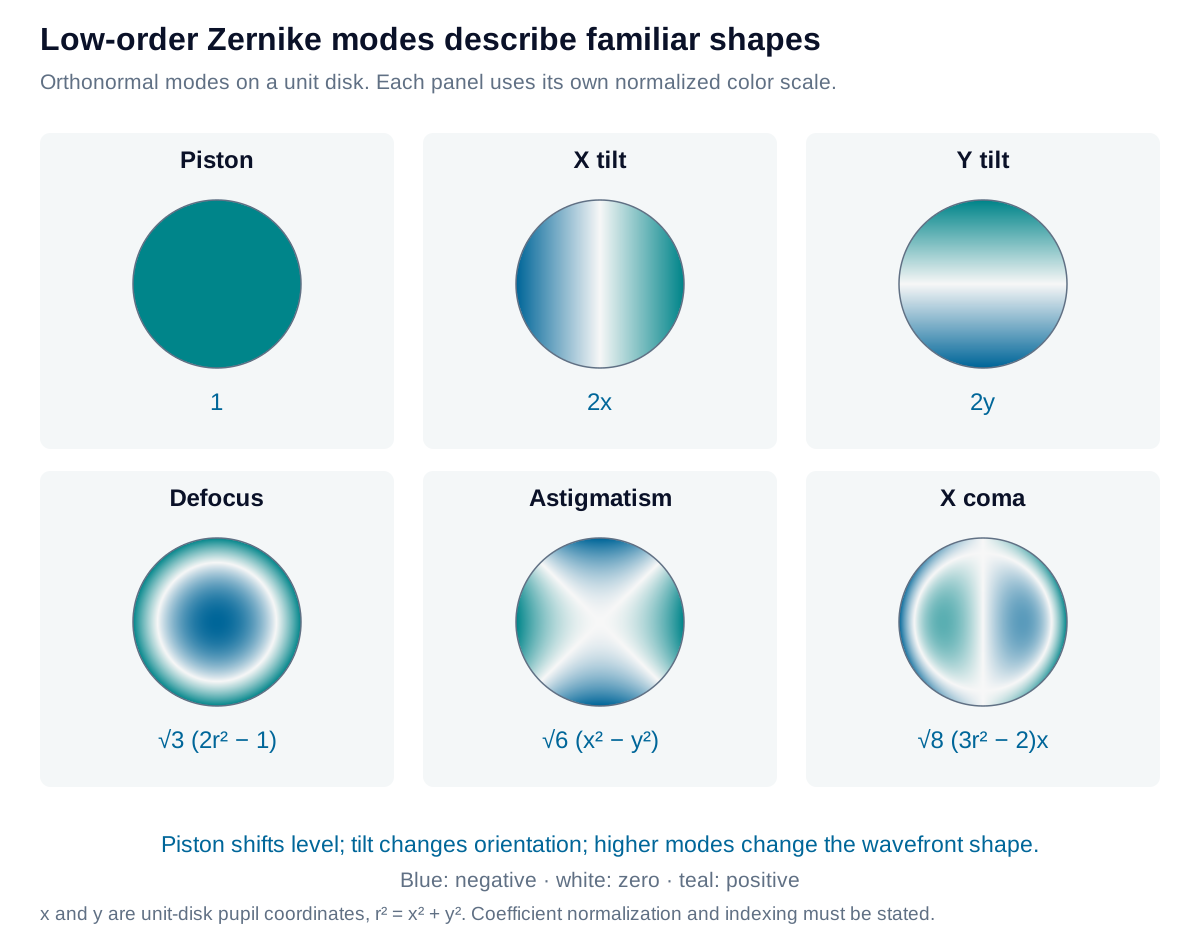
Low-order Zernike modes show piston, two tilts, defocus, astigmatism, and coma on a circular pupil using one normalized convention.

View diagram at full size

Connect surface error with optical error

SFE and wavefront error both use length units, but describe different quantities. In air, reflective surface departure hh produces approximately WR=2hcos⁡θW_R=2h\cos\theta, with incidence angle θ\theta measured from the surface normal. For a homogeneous, near-normal plane-parallel plate of phase refractive index nn, local thickness variation produces approximately:

δWT=(n−1)δt,δt=hback−hfront\delta W_T=(n-1)\delta t,\qquad \delta t=h_{\mathrm{back}}-h_{\mathrm{front}}

Thus surface form errors can contribute to transmitted wavefront error (TWE), but both surfaces, their registration, refractive-index inhomogeneity, and ray deflection matter. One surface’s SFE cannot determine TWE by itself.
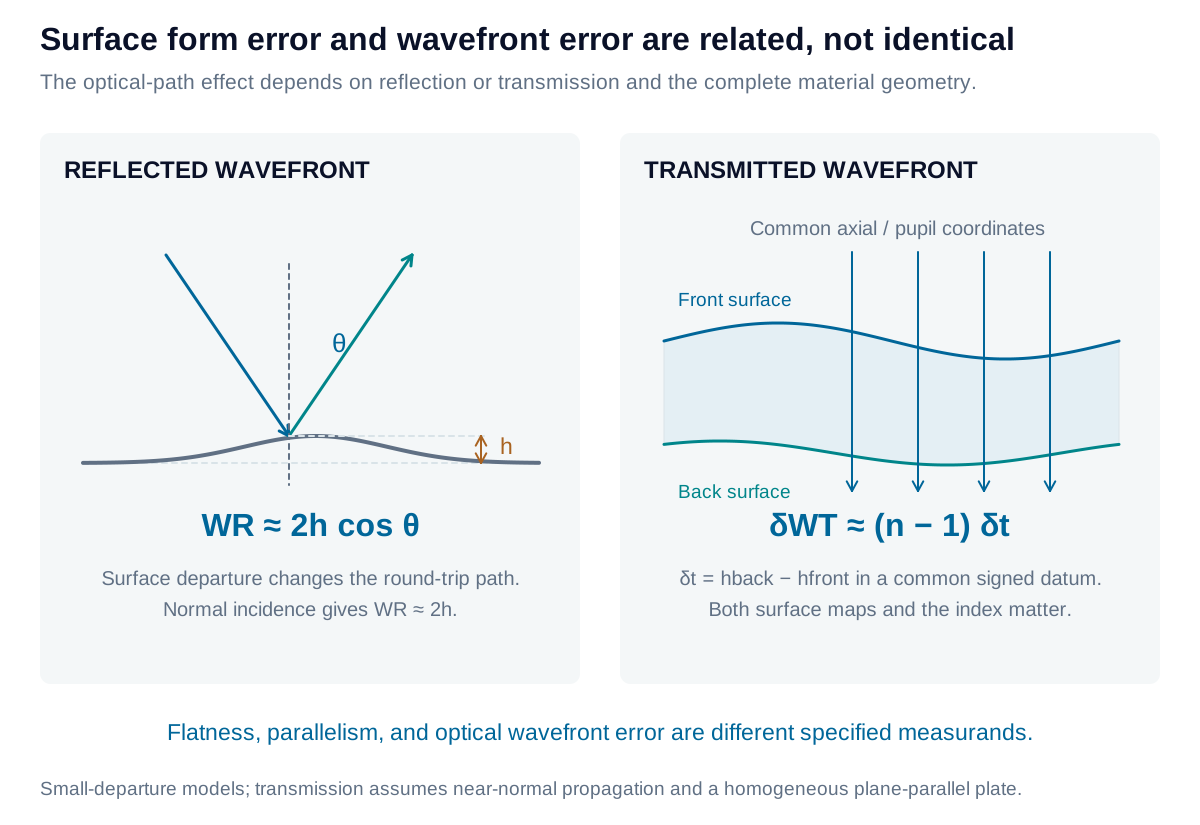
Surface form departure changes reflected optical path, while two surfaces and material index determine the transmitted wavefront of a plate.

View diagram at full size

Relate fitted modes to GD&T without confusing the specifications

A plane fit can describe level and tilt, while low-order curvature can describe bow or optical power. These are useful geometric interpretations, not replacements for drawing requirements. Flatness is a form tolerance independent of a datum; parallelism relates orientation to a datum; profile tolerances compare a surface with the specified nominal geometry under their stated datum conditions. Straightness applies to a defined line element or axis, rather than the entire areal map.

For a plate with front and back heights measured along the same axial direction, the local material replaces an equal thickness of air. Relative to a nominal plate, that replacement changes optical path by (n−1)δt(n-1)\delta t. This approximation assumes uniform phase index, small slopes, near-normal propagation, and common pupil registration. A shared surface ripple on both faces can produce little thickness variation even though each surface has form error; conversely, index variations can distort the transmitted wavefront without changing external geometry.

With orthonormal Zernike modes over a complete uniformly weighted unit disk, mean-removed wavefront RMS is the square root of the sum of squared non-piston coefficients. A clipped pupil, nonuniform weighting, missing data, or another normalization changes that relation. Removing tilt or defocus must be permitted by the optical test specification; removal changes the reported wavefront error.

Iris Optics can define surface and wavefront measurands, select defensible filtering and fitting conventions, and connect geometric inspection with the optical performance that the assembly must deliver.

Explore the measurement

Separate profile tilt from residual surface error

Inspect how reference removal changes peak-to-valley and RMS for a uniformly sampled profile. The example is synthetic.

Residual PV
1.5348 µm
Residual RMS
0.39506 µm
Removed slope
0.2949 µm/mm
Measured profile span
10 mm

Removing a line removes offset and tilt. This does not separate waviness from roughness; that requires a specified spatial filter and bandwidth.

Separate profile tilt from residual surface error: interactive plotHeight / µm against Profile position / mm. Raw profile; Removed reference; Residual profile.-0.8-1.1092.10.128751.3667.92.60410.83.841Profile position / mmHeight / µm
Raw profileRemoved referenceResidual profile
Formula & assumptions

Residual ri = zi − zfit(xi). PV = max(ri) − min(ri); RMS = √(Σri²/N).

Three to 2,000 equally spaced, increasing x positions. RMS uses the spatial denominator N. The selected reference is removed without S/L spatial filtering, outlier deletion, nominal curved-form subtraction, minimum-zone fitting or proprietary PVr calculation. Therefore these are descriptive residual-profile metrics, not certified Ra/Rq/Sq or GD&T results. Keep the raw profile and the removal convention with the result.

Explore the measurement

Explore surface form with Zernike modes

Combine named, RMS-normalized modes on a complete circular aperture. Here the map represents surface form error in nanometres.

Mean surface height (piston)
0 nm
Sampled surface PV
222.19 nm
Analytic RMS after piston removal
53.852 nm
Analytic RMS after piston and tilt removal
53.852 nm

The color scale follows the current height range. This is an SFE map. The same mathematical modes may describe a wavefront, but those coefficients would represent OPD instead of surface height.

Zernike surface form error: interactive mapComplete normalized circular aperture. Height ranges from -86.603 to 135.59 nanometres; color scale changes with the input coefficients.Normalized aperture x (−1 to +1)Normalized aperture y (−1 to +1)135.59 nm24.495 nm-86.603 nm
Surface height, not transmitted wavefront error. Colors encode the current range; compare numeric scales between maps.
Formula & assumptions

h(x,y) = Σ aj Zj(x,y). For these orthonormal modes on a complete, uniformly weighted disk, mean-removed RMS = √(Σ aⱼ²), excluding piston.

Synthesis of an ideal SFE map, not a fit to measured data. Piston = 1; X/Y tilt = 2x/2y; defocus = √3(2r²−1); astigmatism = √6(x²−y²) and 2√6xy; coma = √8(3r²−2)x or y; primary spherical = √5(6r⁴−6r²+1). The plotted 41×41 grid gives a sampled PV; analytic coefficient RMS is exact for the stated disk convention. Obscured/clipped pupils, weighting and other normalizations change the relationship. Removing tilt or power must follow the specification, not improve the reported number by convenience.

Explore the measurement

Connect surface error to wavefront error

Compare reflective sensitivity with the thickness-variation contribution to transmitted wavefront error in a homogeneous plate.

Signed wavefront OPD contribution
200 nm
OPD / height sensitivity
2 ×

At normal incidence, 100 nm of mirror surface-height error contributes 200 nm of reflected OPD in this model.

Connect surface error to wavefront error: interactive plotWavefront OPD contribution / nm against Normal surface form error / nm. Reflective sensitivity; Entered departure.-116-232-58-1160058116116232Normal surface form error / nmWavefront OPD contribution / nm
Reflective sensitivityEntered departure
Formula & assumptions

Reflection in air: W ≈ 2h cos θ. Homogeneous plate in air at normal incidence: W ≈ (n−1)δt, where δt = hback − hfront in a common axial coordinate.

A first-order local signed OPD contribution relative to a nominal optic. This is not a full ray trace or the complete TWE of an assembly. Transmission depends on both surface maps, wedge, ray mapping and index inhomogeneity; one SFE map alone is insufficient. Double-pass test arrangements require their own scaling. Surface height and wavefront error have the same length units but describe different quantities.

From estimate to application

Connect measured surface form to optical performance.

Iris Optics can help define surface form error and transmitted wavefront requirements, select processing conventions, and build repeatable acceptance tests.

Discuss your surface and wavefront metrology