An optical distance sensor infers surface position from light received through a particular geometry. Displacement is the change between positions. A small displayed increment does not establish equally small measurement uncertainty: surface finish, tilt, motion, temperature, and the reference frame all affect the result.
Choose what to measure, then how much to capture
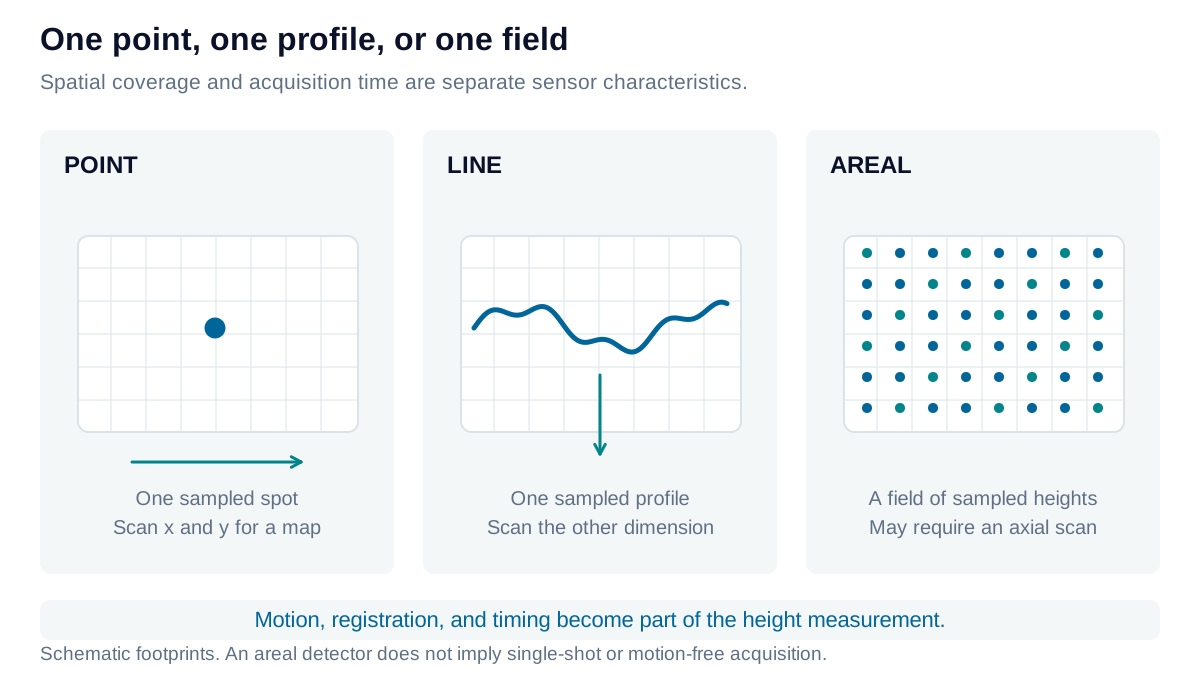
A point sensor samples a spot; a line sensor samples a profile; an areal system samples a field. Motion can assemble points or profiles into a surface map, but encoder errors, vibration, and synchronization then become part of the measurement. An areal instrument may also require multiple exposures or an axial scan.
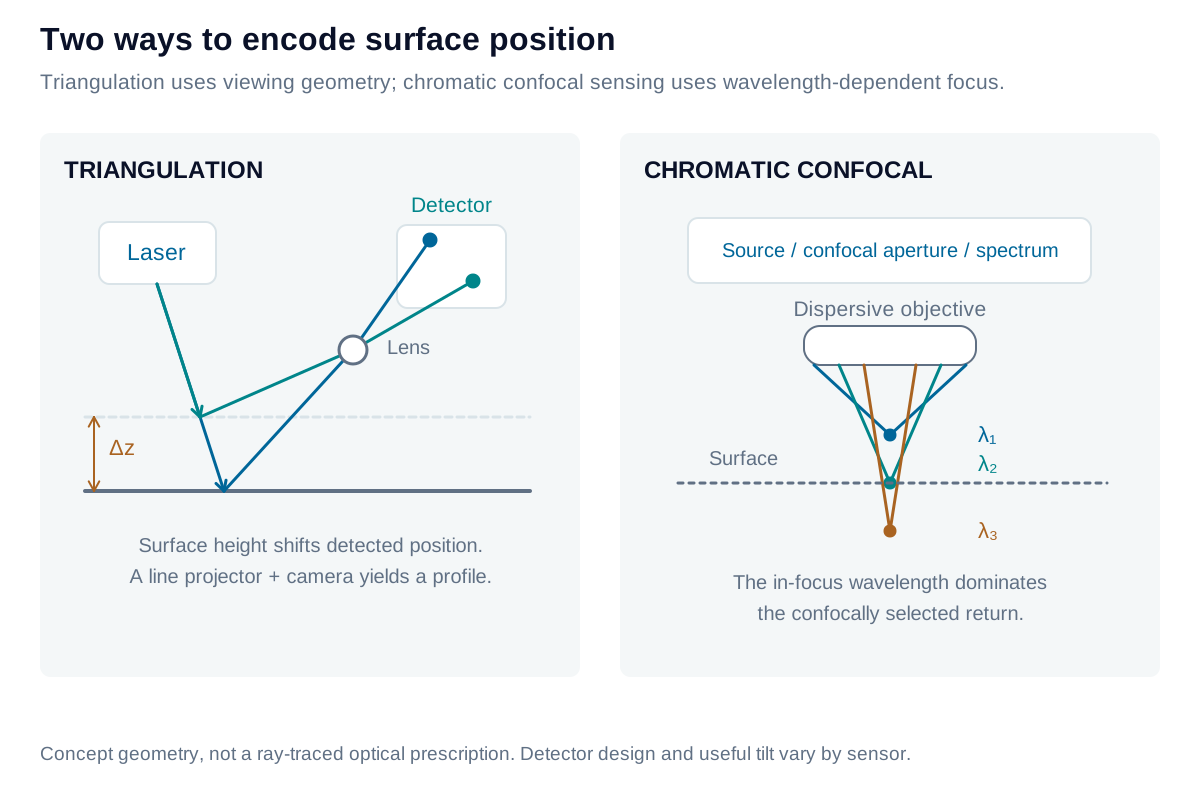
Laser triangulation observes an illuminated spot from an offset receiving aperture. Height changes shift the spot on a position-sensitive detector or camera. A projected line and two-dimensional camera extend this geometry to a profile. Detector format varies by implementation. Diffuse and specular configurations require different receiving geometries; a specular surface can lose signal abruptly when tilted.
Scanning confocal locates the axial intensity maximum as the focus moves. Chromatic confocal deliberately separates focal positions by wavelength; a calibrated spectral peak identifies depth without mechanically sweeping the focus. High numerical aperture can collect returns from steeper surfaces, with working-distance and spot-size tradeoffs. Line confocal systems extend spatial coverage using specialized optical encoding; their architectures are not all equivalent to adding a detector dimension.
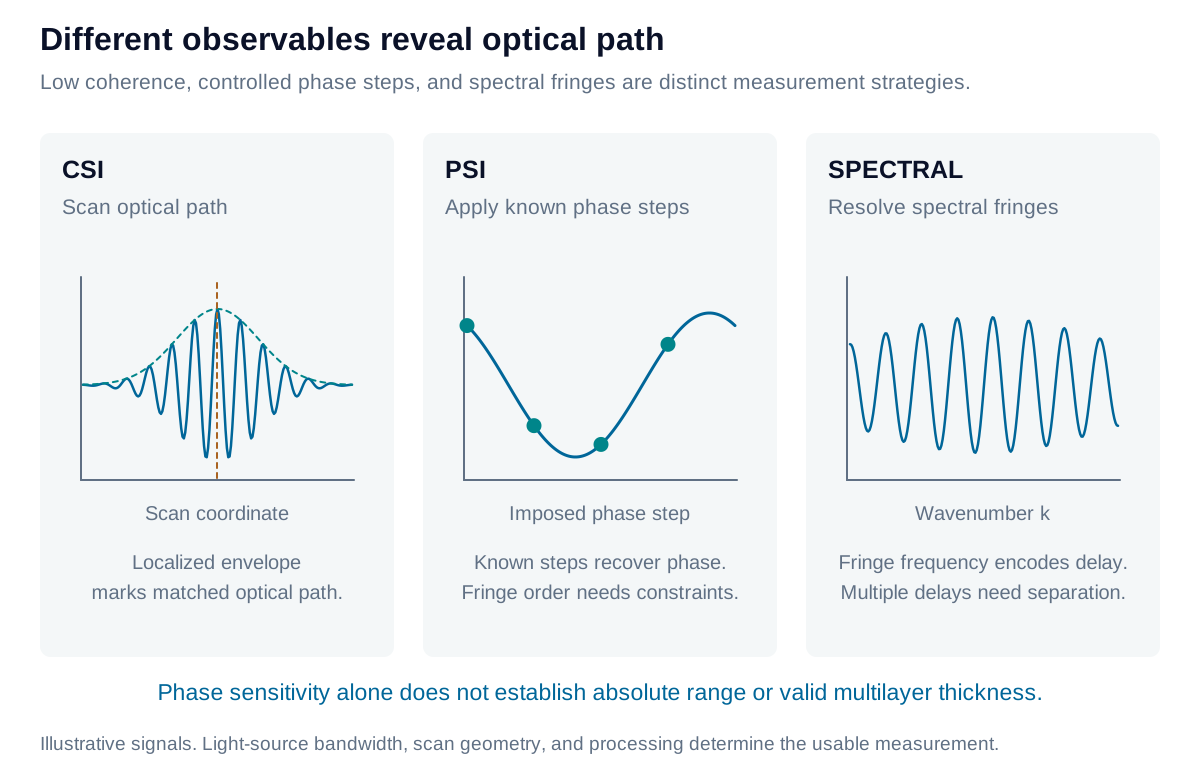
Coherence scanning interferometry (CSI) scans optical path through a localized fringe envelope using a low-coherence source. Phase-shifting interferometry (PSI) introduces known phase steps and solves fringe phase, requiring phase unwrapping or other constraints when the surface spans ambiguous orders. Spectral interferometry measures interference against wavelength or wavenumber to recover optical delays; a swept source is a frequency-domain implementation, rather than a mechanical CSI scan.
These methods may use point or areal detection. Their angular acceptance depends on the actual aperture, reference geometry, and surface scattering—not on “interferometry” as a single category.
For a single reflected beam, an unwrapped phase change Δϕ gives normal displacement:
Δz=4πncosθλ0Δϕ
Here λ0 is vacuum wavelength, n is the propagation-medium phase index, and θ is incidence from the surface normal. Positive phase denotes increasing optical path; phase alone does not establish absolute range.
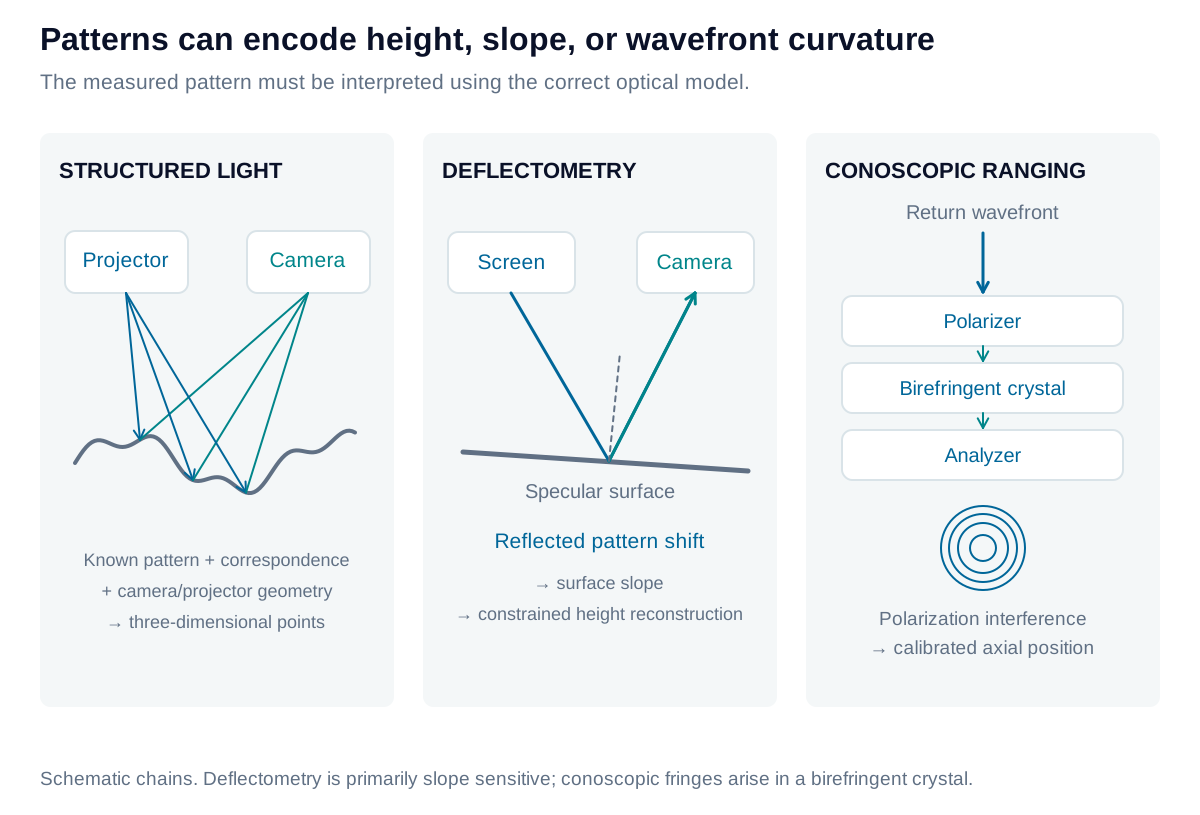
Structured light projects identifiable patterns and triangulates corresponding camera observations into three-dimensional points. Deflectometry observes a known pattern reflected by a specular surface. Pattern displacement primarily encodes surface slope; recovering height requires calibrated geometry and a reconstruction constraint.
Conoscopic holography sends returned light through polarization optics and a birefringent crystal. Two polarization components acquire different angle-dependent phases and interfere after an analyzer. The resulting fringe pattern encodes wavefront curvature, which a calibrated model converts to axial distance. It uses a nearly common optical path rather than a conventional separated reference arm.
Light returning from a small illuminated surface region forms a wavefront whose curvature depends on the region’s axial position and the receiving optics. In a uniaxial birefringent crystal, the ordinary and extraordinary polarization components propagate with different effective refractive indices. Their phase difference depends on propagation direction through the crystal.
An analyzer combines both components into a common polarization so that they can interfere. The detector records a spatial fringe pattern, often represented as rings in a symmetric configuration. Changing object position changes the wavefront presented to the crystal and therefore the measured fringe scale or spatial frequency. The instrument converts that pattern to distance using its calibrated optical geometry.
The two components largely share the same path, which reduces some differential-path disturbances. It does not eliminate surface-dependent errors, vibration, fringe ambiguity, or the need to calibrate the instrument’s operating interval. The measurement is a position estimate from a fringe pattern, rather than a reconstructed photographic hologram of the object.
Additional methods and practical limits
Pulsed time of flight measures round-trip delay, with z=cΔt/(2ng) in a uniform medium. Continuous-wave phase ranging instead measures modulation phase and has an ambiguity interval. FMCW LiDAR mixes a frequency-chirped return with a reference; beat frequency estimates delay, while target velocity can contribute a Doppler term. These methods suit longer ranges, subject to bandwidth, signal level, multipath, and motion constraints.
Laser Doppler vibrometry measures the Doppler shift of returned light, principally providing velocity along the sensitivity direction. Displacement can be obtained by integration or appropriate demodulation, but drift and reference conditions matter. It is not automatically an absolute stand-off measurement.
Focus variation estimates height from the focus position that maximizes local image sharpness. It benefits from surface texture; smooth transparent or mirror-like regions may supply too little usable contrast. A visually sharp focus-stacked image is not, by itself, a calibrated height map.
For a simple single-sided acceptance cone in air, NA=sinα. This optical collection angle is not a universal allowable surface slope. Specular reflection changes return direction by approximately twice the surface tilt, while illumination and collection pupils may overlap differently in each architecture. Confirm usable tilt on representative material rather than converting NA directly into a guaranteed sensor specification.
Compare the complete measurement chain
Keep stand-off, axial measurement range, lateral sampling, resolution, repeatability, and linearity separate. Specify the averaging, bandwidth, target, and environment behind each number. The comparison below is a screening aid; a weighted preference cannot compensate for a failed material, access, speed, or uncertainty requirement.
Iris Optics can evaluate representative parts, compare viable sensing principles, and develop the fixture, motion, calibration, and analysis needed to turn a sensor specification into a dependable measurement system.
From principle to selection
Build a sensor selection matrix
Use a Kepner–Tregoe-style decision sequence: define mandatory requirements first, then score the preferences that distinguish feasible options. Surface compatibility, clearance, usable range, uncertainty, and required production speed are useful first gates. A missing specification requires a test or quotation.
For the remaining options, assign weights to the criteria and scores against the same evidence: S = Σ wᵢsᵢ. A high weighted score cannot rescue a failed mandatory requirement. Review implementation risks before selecting a system.
Range and vertical sensitivity span different scales
These named examples give the trade-off map a numerical scale. They are individual configurations, not technology-wide limits. Circle markers report repeatability; diamonds report a manufacturer's resolution or dynamic-noise value. Averaging and test conditions differ, so proximity on this plot does not establish equivalent performance.
Blue: point triangulation. Amber: line triangulation. Teal: chromatic confocal. ● Repeatability. ◆ Resolution/noise specification. The two IFS2405 examples use the same 1 kHz dynamic-RMS definition: a longer-range probe also has a larger quoted noise bound. Other comparisons require matched tests.Read the six plotted specifications and their conditions
1. KEYENCE LK-H020
6 mm axial span; 20 mm reference distance; nominal interval 17–23 mm. repeatability: 0.02 µm (published value).
Standard target at reference distance; 16,384-reading averaging. Not single-shot or maximum-rate precision.
25 µm spot; linearity ±0.02% of 6 mm full scale under the specified reference-target conditions.
2. KEYENCE LJ-X8020
4.4 mm axial span; 20 mm reference distance; nominal Z interval 17.8–22.2 mm. repeatability: 0.3 µm (Z-height, averaged region).
Standard target at reference distance; 4,096-reading averaging; average height of the default region. Not per-pixel single-shot noise.
7.5 mm profile width at reference; 2.5 µm nominal X interval. Maximum 16 kHz requires restricted range/binning conditions.
3. Micro-Epsilon ILD2300-2
2 mm axial span; 24 mm start of measuring range; nominal interval 24–26 mm. resolution: 0.03 µm (manufacturer resolution).
20 kHz measuring rate; white diffuse reference ceramic. This resolution is not the repeatability metric used by other rows.
Linearity < ±0.6 µm; approximately 23 × 23 µm spot at midrange. Electronics are integrated.
4. Micro-Epsilon IFS2405-0.3
0.3 mm axial span; 6 mm approximate start of measuring range; interval about 6–6.3 mm. resolution: < 0.018 µm (dynamic RMS-noise upper bound).
Dynamic resolution <18 nm at midrange, 1 kHz. Separately, static <2 nm uses 512-reading averaging; do not combine these conditions.
6 µm spot; NA 0.60; usable mirrored-surface signal to ±34°, with accuracy degrading near the angular limit.
5. Micro-Epsilon IFS2405-6
6 mm axial span; 63 mm approximate start of measuring range; interval about 63–69 mm. resolution: < 0.19 µm (dynamic RMS-noise upper bound).
Dynamic resolution <190 nm at midrange, 1 kHz. Static <17 nm uses averaging. Compare configurations using the same metric and bandwidth.
31 µm spot; NA 0.22; usable mirrored-surface signal to ±10°, with accuracy degrading near the angular limit.
6. LMI FocalSpec LCI1220
3 mm axial span; 20.6 mm manufacturer stand-off specification. repeatability: 0.19 µm (published Z repeatability).
Manufacturer summary does not fully state the repeatability protocol. 3,000 profiles/s at full range; 16,000 profiles/s is a separate maximum.
11.6 mm field; 6.7 µm X sampling; stated mirror-surface slope limit ±20°. Off-axis line-confocal architecture.
Technology selection matrix
The same thirteen technology families appear in each part of the matrix. Use these prompts to define the test conditions and the evidence required from a supplier. The named specifications above illustrate selected configurations; a family does not have one universal numerical range, spot size, or repeatability.
Compare range, stand-off, and axial performance
Compare range, stand-off, and axial performance
Technology
Measurement range
Stand-off / clearance
Resolution
Repeatability / precision
Linearity
Point laser triangulationKEYENCE LK-G5000; Micro-Epsilon optoNCDT ILD2300
Head-specific axial span; more span usually trades away height sensitivity.
Separate reference distance from the usable near-to-far interval.
Image localization and signal quality limit usable changes; display digits are insufficient.
Target finish, speckle, averaging, and bandwidth matter.
Check the calibrated depth interval and the stated target material.
Laser line triangulationKEYENCE LJ-X8000; Micro-Epsilon scanCONTROL
Specify both Z span and X field width; width can vary with depth.
Reference distance fixes clearance and the near/far profile widths.
X sample pitch, laser width, and Z discrimination are different specifications.
Averaged area height can be much more stable than individual profile points.
Check smoothing and averaging used for the published value.
Point probes; scanning builds profiles/maps; line architectures have been demonstrated.
Coaxial access reduces triangulation shadowing; published steep-angle claims depend on surface scattering.
Sensor- and signal-dependent; inspect the actual acquisition configuration.
Objective-dependent illuminated spot; not the fringe diameter on the detector.
Documented inline and CMM-integrated probes; confirm current supply and support.
Time of flight / FMCW rangingMicro-Epsilon optoNCDT ILR; ST FlightSense ToF; Aeva FMCW LiDAR
Point, scanned, or array sensors.
Return strength and footprint vary with incidence; no universal slope limit.
Distinguish individual returns, point-cloud rate, and full-frame rate.
Beam divergence or pixel field of view grows the footprint with distance.
Inline positioning, robotics, and larger-volume ranging.
Laser Doppler vibrometryPolytec vibrometers
Point; scanning maps vibration over selected locations.
Measures the velocity component along the beam; surface return must be sufficient.
Frequency bandwidth and sampling rate need separate specifications.
Focused measurement spot; scanning location is not continuous areal capture.
Laboratory and industrial end-of-line vibration testing.
Focus variationBruker Alicona focus-variation systems
Areal, often with stitched fields.
Textured steep surfaces can be accessible if illumination and viewing remain adequate.
Full Z-stack acquisition and reconstruction determine map time.
Image neighborhood used by the focus measure; not a point beam.
Benchtop and automated metrology systems.
Compare head, controller, and complete-system cost
The reviewed suppliers do not provide a verified public price for a comparable installed configuration. Request head, controller, optics, software, motion, fixture, and calibration costs separately; a used head or development-board price is not a system budget.
Configured system cost requirements
Technology
Sensor head
Controller / electronics
Complete system
Budget boundary
Point laser triangulation
Request a configured quote
Integrated on some heads; external on others
No verified public installed-system price
Budget the complete configuration, fixtures, motion, calibration, software, and integration.
Laser line triangulation
Request a configured quote
Confirm required electronics and licenses
No verified public installed-system price
Budget the complete configuration, fixtures, motion, calibration, software, and integration.
Coherence scanning interferometry
Request a configured quote
Usually part of a configured instrument
No verified public installed-system price
Budget the complete configuration, fixtures, motion, calibration, software, and integration.
Phase-shifting interferometry
Request a configured quote
Camera, phase control, computer, and analysis licenses
No verified public installed-system price
Budget the complete configuration, fixtures, motion, calibration, software, and integration.
Spectral interferometry
Request a configured quote
Confirm required electronics and licenses
No verified public installed-system price
Budget the complete configuration, fixtures, motion, calibration, software, and integration.
Axially scanning confocal
Request a configured quote
Confirm required electronics and licenses
No verified public installed-system price
Budget the complete configuration, fixtures, motion, calibration, software, and integration.
Chromatic confocal
Request a configured quote
Confirm required electronics and licenses
No verified public installed-system price
Budget the complete configuration, fixtures, motion, calibration, software, and integration.
Structured-light triangulation
Projector/camera assembly or integrated scanner
Acquisition computer and reconstruction software
No verified public installed-system price
Budget the complete configuration, fixtures, motion, calibration, software, and integration.
Deflectometry
Pattern display plus calibrated camera assembly
Confirm required electronics and licenses
No verified public installed-system price
Budget the complete configuration, fixtures, motion, calibration, software, and integration.
Conoscopic holography
Request a configured quote
Confirm required electronics and licenses
No verified public installed-system price
Current manufacturer pricing and availability were not independently verified.
Time of flight / FMCW ranging
Request a configured quote
Integrated or separate; embedded chips are not complete metrology systems
No verified public installed-system price
Budget the complete configuration, fixtures, motion, calibration, software, and integration.
Laser Doppler vibrometry
Request a configured quote
Confirm required electronics and licenses
No verified public installed-system price
Budget the complete configuration, fixtures, motion, calibration, software, and integration.
Focus variation
Request a configured quote
Usually part of a configured instrument
No verified public installed-system price
Budget the complete configuration, fixtures, motion, calibration, software, and integration.
Resolution, repeatability, linearity, and uncertainty answer different questions. Precision must be checked at the required rate, averaging, target, angle, and environmental conditions. Confirm pricing, support, and availability for the proposed configuration; historical product examples do not guarantee current supply. A representative-part trial and a documented uncertainty budget are more useful than a ranking assembled from incompatible headline specifications.
Explore the measurement
Scan speed and spatial sampling
Connect a point or line sensor’s acquisition rate to the spacing of measurements along a moving part.
Sample spacing along travel
50 µm
Nominal Nyquist spatial period
100 µm
First eleven acquisition positionsFormula & assumptions
Pitch Δx = v/fs. The nominal Nyquist spatial period is 2Δx.
Uniform speed, synchronized valid measurements, no dropped samples. The optical spot, line-pixel pitch, motion blur and system transfer function also limit lateral detail. Two samples per period is a sampling boundary, not a reliable resolution or feature-detection specification. At zero speed, repeated measurements revisit the same position.
Explore the measurement
Phase change and reflective displacement
Calculate signed displacement from an unwrapped phase change in a simple reflective interferometer.
Δh = λ₀ Δφ / (4π n cos θ). One 2π phase cycle corresponds to λ₀/(2n cos θ) of normal displacement.
The displacement is normal to a locally reflecting surface in this stated geometry. The sign follows the chosen phase convention. A wrapped phase alone leaves an unknown fringe order; this is not an absolute distance sensor model. Medium index and wavelength stability matter. Grazing incidence is excluded, and mathematical validity does not guarantee sufficient returned light.
From estimate to application
Match the sensing principle to the surface and the decision.
Iris Optics can help evaluate return signal, slope, access, scan speed, uncertainty, and integration cost using representative parts.